- Data & Statistics
Access Quick Stats (searchable database)
The Quick Stats Database is the most comprehensive tool for accessing agricultural data published by NASS. It allows you to customize your query by commodity, location, or time period.
Access Quick Stats Lite
Quick Stats Lite provides a more structured approach to get commonly requested statistics from our online database.
Explore Statistics
County Level Information
Geospatial Data & Interactive Maps
- Publications
Browse NASS Reports
- by Subject
- by Date (Reports Calendar)
- by Title/Release Day
- by Keyword
- Guide to Products and Services
Additional Reports
Historical Publications
- Archived Ag Census Reports (2002 and prior - published every 5 years)
- Annual Agricultural Statistics
- Statistical Bulletins (final estimates, 1987 to 2012
- Track Records: (crops, livestock, grain stocks)
- Trends 20th century
- Price Reactions (after crop or livestock reports)
Receive Reports by Email:
- Newsroom
News Releases
04/15/24 USDA NASS announces retirement of Administrator Hubert Hamer
03/28/24 United States hog inventory up 1%
03/28/24 US farmers expect to plant less corn and more soybean acres
03/26/24 USDA to host Data Users’ Meeting to gather public input on statistical programs
Read More News
ASB Notices
04/15/24 NASS appoints Lance Honig as new ASB Chair
04/09/24 NASS discontinues select 2024 data collection programs and reports
04/04/24 NASS announces program changes following five-year review
02/23/24 NASS Delays Cold Storage Data Release
12/19/23 NASS seeks public input during survey program review
Read More Notices
Videos
02/13/24 2022 Census of Agriculture Data Highlights
02/13/24 How to Find 2022 Census of Agriculture Data
02/13/24 2022 Census of Agriculture Data Release Event
07/16/21 What is a Farm?
08/05/20 The NASS Mission: We do it for you
View More Videos
ASB Briefings
04/17/24 National Hemp Report (April 2024)
04/11/24 Crop Production (April 2024)
03/28/24 Quarterly Hogs and Pigs (March 2024)
03/28/24 Grain Stocks, Prospective Plantings, Rice Stocks (March 2024)
03/08/24 Crop Production (March 2024)
View More Briefings
- Surveys
- Census
- About NASS
Structure and Organization
- Agency Overview
- NASS Biographies
- Organizational Chart
- Assistance to Other Organizations
- International Programs
- NASS Strategic Plan for FY 2022-2026
- USDA Strategic Goals
- NASS Climate Adaptation and Resilience Plan
Guiding Principles
- Mission and Core Values
- Keeping Data Safe
- Confidentiality Pledge
- Security Pledge
- Security Statement
- Statement of Commitment to Scientific Integrity
- Regulations Guiding NASS
- Information Quality
Civil Rights
- USDA and NASS Civil Rights Policy Statement
- Civil Rights Accountability Policy and Procedures
- No FEAR Act Notice
- No FEAR Act - NASS Data
-
REE Reasonable Accommodations and Personal Assistance Services
- NASS Disability Affirmative Action Plan
- How to File an EEO Complaint
- Contact information for NASS Civil Rights Office
Work at NASS
Education and Outreach
- Understanding Ag Statistics
- Data Users' Meetings
- Morris Hansen Lecture
- International Conference on Agricultural Statistics
History and Procedures
- Agricultural Statistics Board and Lockup
- Agricultural Statistics: A Historical Timeline
- The Story of U.S. Agricultural Estimates
- As We Recall: The Growth of Agricultural Estimates, 1933-1961
-
Safeguarding America's Agricultural Statistics Report and Video
- History of Ag Statistics
- Report Procedures
- An Evolving Statistical Service
- Fact Finders for Agriculture
- Hall of Fame
- Contact Us
Mailing Address:
USDA-NASS
1400 Independence Ave., SW
Washington, DC 20250Survey FAQs and Contact Us:
Access FAQs or submit a question.
Data Inquiries:
Hours: 7:30 a.m. - 4:00 p.m. Eastern Time
Monday - Friday, except federal holidays
Toll-Free: (800) 727-9540Media Inquiries:
Other USDA Inquiries:
Hours: 9:00 a.m. - 5:30 p.m. Eastern Time
Monday - Friday, except federal holidays
Toll-Free: (833) One-USDA
Email: askusda@usda.gov
Website: https://ask.usda.gov/s/Civil Rights Office:
June Turner, Director
Email: / Phone: (202) 720-8257Regional and State Field Offices:
Find contact information for Regional and State Field Offices
Ask a Specialist:
Have a specific question for one of our subject experts? Contact a specialist.
Web Content Publishing Schedule:
Section 207(f)(2) of the E-Government Act of 2002 requires federal agencies to develop an inventory of information to be published on their Web sites, establish a schedule for publishing information, make those schedules available for public comment, and post the schedules and priorities on the Web site.
- Help
Technical Issues
Research and Science
Cropland Data Layers - FAQs
CroplandCROS | FAQ | Metadata | National Download | Other CDL Citations
List of CDL codes, class names, and RGB color values: (xls, xlsx)
Metadata in various formats available at Data.Gov
Frequently anticipated questions:
- What does this data set describe?
- How might this data set be cited?
- What geographic area does the data set cover?
- What does it look like?
- Does the data set describe conditions during a particular time period?
- What is the general form of this data set?
- How does the data set represent geographic features?
- How does the data set describe geographic features?
- Who produced the data set?
- Why was the data set created?
- How was the data set created?
- How reliable are the data; what problems remain in the data set?
- How can someone get a copy of the data set?
- Who wrote the metadata?
- CDL Program History
- Common User Questions
- Is the Cropland Data Layer available in a shapefile format?
- What differences can be expected when comparing CDL-based acreage and official NASS statistics?
- What projections are used?
- Are color legends available for the Cropland Data Layers?
- Has someone compiled all of the exported CDL attribute tables by year and state into a master spreadsheet?
- Has someone summarized CDL acreage for all land cover categories at the county-level for the Continental United States?
- Is more detailed accuracy assessment information available than what is provided in the metadata? Can you provide the full accuracy assessment error/confusion matrices for all states?
- NASS says this is a Cropland data layer product, what about the areas that are not agriculturally intensive?
- Are more detailed CDL category definitions available?
- Does the CDL differentiate between grassland types such as urban grassland, pastures used for grazing, and other grass-related land cover types?
- How are fields with multiple crop types planted in the same season handled in the Cropland Data Layer, such as winter wheat followed by soybeans?
- Have the attribute names, codes, and/or colors changed over the history of the program?
- How do I add class names and/or histogram values to the GeoTIFF file when viewing the CDL in ESRI ArcGIS Software?
- How can I create a legend for the CDL using ESRI ArcGIS software?
- Is any smoothing or filtering applied to the CDL?
- How do I add category names to a downloaded .tif image in ESRI ArcGIS?
- I am using Erdas Imagine to view downloaded CDL data, but there is no histogram information. How do I build statistics in Erdas Imagine?
- How do I add category names and/or colors to my downloaded CDL data in Erdas Imagine?
- What other geospatial products does NASS offer, such as the Cultivated Layer, Crop Frequency Data Layers, Confidence Layer, and Crop Sequence Boundaries?
What does this data set describe?
-
Title: Cropland Data Layer
Abstract:
The USDA National Agricultural Statistics Service (NASS) Cropland Data Layer (CDL) is an annual raster, geo-referenced, crop-specific land cover data layer produced using satellite imagery and extensive agricultural ground reference data. The program began in 1997 with limited coverage and in 2008 forward expanded coverage to the entire Continental United States. Please note that no farmer reported data are derivable from the Cropland Data Layer.
The 2008 to current CDLs have a spatial resolution of 30 meters and were produced using moderate spatial resolution satellite imagery. The current program uses Landsat 8 and 9 OLI/TIRS and ESA SENTINEL-2A and -2B collected throughout the growing season. Past years of CDL have used other satellite-based sensors such as Landsat 5 and 7, ISRO ResourceSat-2 LISS-3, IRS AWiFS, Diemos-1 and UK-DMC-2, and MODIS 16-Day NDVI Composite. Some CDL states used additional ancillary inputs to supplement and improve the land cover classification including historical CDL data, the United States Geological Survey (USGS) National Elevation Dataset (NED), USDA National Resources Conservation Service (NRCS) National Commodity Crop Productivity Index (NCCPI), and the most current versions of the USGS National Land Cover Database imperviousness and the tree canopy data layers. Agricultural training and validation data are derived from the Farm Service Agency (FSA) Common Land Unit (CLU) Program. Some CDL states incorporate additional crop-specific ground reference obtained from the following non-FSA sources which are detailed in the 'Lineage' Section of this metadata: US Bureau of Reclamation, NASS Citrus Data Layer (internal use only), California Department of Water Resources, Florida Department of Agriculture and Consumer Services Office of Agricultural Water Policy, Cornell University grape/vineyard data, Oregon State University tree crop and vineyard data, Utah Department of Water Resources, and Washington State Department of Agriculture. The most current version of the NLCD is used as non-agricultural training and validation data.
The 2008 to current CDLs have a spatial resolution of 30 meters and were produced using moderate spatial resolution satellite imagery. The current program uses Landsat 8 and 9 OLI/TIRS and ESA SENTINEL-2A and -2B collected throughout the growing season. Past years of CDL have used other satellite-based sensors such as Landsat 5 and 7, ISRO ResourceSat-2 LISS-3, IRS AWiFS, Diemos-1 and UK-DMC-2, and MODIS 16-Day NDVI Composite. Some CDL states used additional ancillary inputs to supplement and improve the land cover classification including historical CDL data, the United States Geological Survey (USGS) National Elevation Dataset (NED), USDA National Resources Conservation Service (NRCS) National Commodity Crop Productivity Index (NCCPI), and the most current versions of the USGS National Land Cover Database imperviousness and the tree canopy data layers. Agricultural training and validation data are derived from the Farm Service Agency (FSA) Common Land Unit (CLU) Program. Some CDL states incorporate additional crop-specific ground reference obtained from the following non-FSA sources which are detailed in the 'Lineage' Section of this metadata: US Bureau of Reclamation, NASS Citrus Data Layer (internal use only), California Department of Water Resources, Florida Department of Agriculture and Consumer Services Office of Agricultural Water Policy, Cornell University grape/vineyard data, Oregon State University tree crop and vineyard data, Utah Department of Water Resources, and Washington State Department of Agriculture. The most current version of the NLCD is used as non-agricultural training and validation data.
Supplemental_Information:
The data is available free for download through CroplandCROS at <https://croplandcros.scinet.usda.gov/>. Metadata, Frequently Asked Questions (FAQs), and the most current year of data is available free for download at the official website <https://www.nass.usda.gov/Research_and_Science/Cropland/SARS1a.php>.
- How might this data set be cited?
United States Department of Agriculture (USDA) National Agricultural Statistics Service (NASS), 20240131, Cropland Data Layer: USDA NASS, USDA NASS Marketing and Information Services Office, Washington, D.C.
Online Links: https://croplandcros.scinet.usda.gov/
-
Other_Citation_Details:
NASS maintains a Frequently Asked Questions (FAQ's) section on the CDL website at <https://www.nass.usda.gov/Research_and_Science/Cropland/SARS1a.php>. The data is available free for download through CroplandCROS <https://croplandcros.scinet.usda.gov/> and the Geospatial Data Gateway <https://datagateway.nrcs.usda.gov/>. - What geographic area does the data set cover?
-
West_Bounding_Coordinate: -127.8459
East_Bounding_Coordinate: -67.0096
North_Bounding_Coordinate: 49.3253
South_Bounding_Coordinate: 24.3321
- What does it look like?
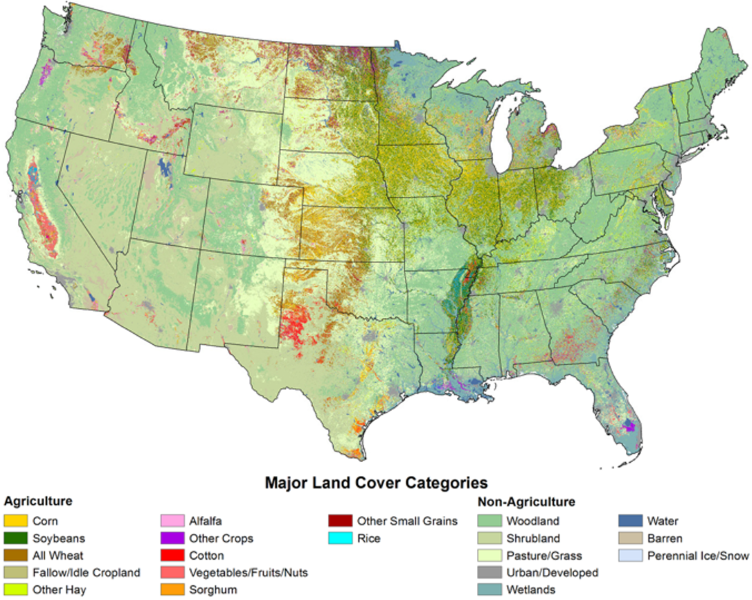 There are over 100 potential land cover categories. The legend above lists only a subset of available categories.
- Does the data set describe conditions during a particular time period?
-
Beginning_Date: 1997
Ending_Date: annual, ongoing
Currentness_Reference: annual growing season
- What is the general form of this data set?
-
Geospatial_Data_Presentation_Form: raster digital data, typically Geotiff (.tif)
- How does the data set represent geographic features?
- How are geographic features stored in the data set?
-
Indirect_Spatial_Reference: Continental United States
- Dimensions 96523 x 153811, type Pixel
- What coordinate system is used to represent geographic features?
The map projection used is (EPSG:5070) Albers Conical Equal Area as used by mrlc.gov (NLCD).
- Projection parameters:
-
-
Standard_Parallel: 29.500000
Standard_Parallel: 45.500000
Longitude_of_Central_Meridian: -96.000000
Latitude_of_Projection_Origin: 23.000000
False_Easting: 0.000000
False_Northing: 0.000000
Abscissae (x-coordinates) are specified to the nearest 30
Ordinates (y-coordinates) are specified to the nearest 30
Planar coordinates are specified in meters
The horizontal datum used is North American Datum of 1983.
The ellipsoid used is Geodetic Reference System 80.
The semi-major axis of the ellipsoid used is 6378137.000000.
The flattening of the ellipsoid used is 1/298.257223563.
- How are geographic features stored in the data set?
- How does the data set describe geographic features?
-
Entity_and_Attribute_Overview:
The Cropland Data Layer (CDL) is produced using agricultural training data from the Farm Service Agency (FSA) Common Land Unit (CLU) Program and non-agricultural training data from the most current version of the United States Geological Survey (USGS) National Land Cover Database (NLCD). The strength and emphasis of the CDL is crop-specific land cover categories. The accuracy of the CDL non-agricultural land cover classes are entirely dependent upon the NLCD. Thus, the USDA NASS recommends that users consider the NLCD for studies involving non-agricultural land cover.Entity_and_Attribute_Detail_Citation:Data Dictionary: USDA National Agricultural Statistics Service, Cropland Data Layer Source: USDA National Agricultural Statistics Service The following is a cross reference list of the categorization codes and land covers. Note that not all land cover categories listed below will appear in an individual state. Raster Attribute Domain Values and Definitions: NO DATA, BACKGROUND 0 Categorization Code Land Cover "0" Background Raster Attribute Domain Values and Definitions: CROPS 1-60 Categorization Code Land Cover "1" Corn "2" Cotton "3" Rice "4" Sorghum "5" Soybeans "6" Sunflower "10" Peanuts "11" Tobacco "12" Sweet Corn "13" Pop or Orn Corn "14" Mint "21" Barley "22" Durum Wheat "23" Spring Wheat "24" Winter Wheat "25" Other Small Grains "26" Dbl Crop WinWht/Soybeans "27" Rye "28" Oats "29" Millet "30" Speltz "31" Canola "32" Flaxseed "33" Safflower "34" Rape Seed "35" Mustard "36" Alfalfa "37" Other Hay/Non Alfalfa "38" Camelina "39" Buckwheat "41" Sugarbeets "42" Dry Beans "43" Potatoes "44" Other Crops "45" Sugarcane "46" Sweet Potatoes "47" Misc Vegs & Fruits "48" Watermelons "49" Onions "50" Cucumbers "51" Chick Peas "52" Lentils "53" Peas "54" Tomatoes "55" Caneberries "56" Hops "57" Herbs "58" Clover/Wildflowers "59" Sod/Grass Seed "60" Switchgrass Raster Attribute Domain Values and Definitions: NON-CROP 61-65 Categorization Code Land Cover "61" Fallow/Idle Cropland "62" Pasture/Grass "63" Forest "64" Shrubland "65" Barren Raster Attribute Domain Values and Definitions: CROPS 66-80 Categorization Code Land Cover "66" Cherries "67" Peaches "68" Apples "69" Grapes "70" Christmas Trees "71" Other Tree Crops "72" Citrus "74" Pecans "75" Almonds "76" Walnuts "77" Pears Raster Attribute Domain Values and Definitions: OTHER 81-109 Categorization Code Land Cover "81" Clouds/No Data "82" Developed "83" Water "87" Wetlands "88" Nonag/Undefined "92" Aquaculture Raster Attribute Domain Values and Definitions: NLCD-DERIVED CLASSES 110-195 Categorization Code Land Cover "111" Open Water "112" Perennial Ice/Snow "121" Developed/Open Space "122" Developed/Low Intensity "123" Developed/Med Intensity "124" Developed/High Intensity "131" Barren "141" Deciduous Forest "142" Evergreen Forest "143" Mixed Forest "152" Shrubland "176" Grassland/Pasture "190" Woody Wetlands "195" Herbaceous Wetlands Raster Attribute Domain Values and Definitions: CROPS 195-255 Categorization Code Land Cover "204" Pistachios "205" Triticale "206" Carrots "207" Asparagus "208" Garlic "209" Cantaloupes "210" Prunes "211" Olives "212" Oranges "213" Honeydew Melons "214" Broccoli "215" Avocados "216" Peppers "217" Pomegranates "218" Nectarines "219" Greens "220" Plums "221" Strawberries "222" Squash "223" Apricots "224" Vetch "225" Dbl Crop WinWht/Corn "226" Dbl Crop Oats/Corn "227" Lettuce "228" Dbl Crop Triticale/Corn "229" Pumpkins "230" Dbl Crop Lettuce/Durum Wht "231" Dbl Crop Lettuce/Cantaloupe "232" Dbl Crop Lettuce/Cotton "233" Dbl Crop Lettuce/Barley "234" Dbl Crop Durum Wht/Sorghum "235" Dbl Crop Barley/Sorghum "236" Dbl Crop WinWht/Sorghum "237" Dbl Crop Barley/Corn "238" Dbl Crop WinWht/Cotton "239" Dbl Crop Soybeans/Cotton "240" Dbl Crop Soybeans/Oats "241" Dbl Crop Corn/Soybeans "242" Blueberries "243" Cabbage "244" Cauliflower "245" Celery "246" Radishes "247" Turnips "248" Eggplants "249" Gourds "250" Cranberries "254" Dbl Crop Barley/Soybeans
Who produced the data set?
- Who are the originators of the data set?
- United States Department of Agriculture (USDA) National Agricultural Statistics Service (NASS)
- Who also contributed to the data set?
USDA National Agricultural Statistics Service
- To whom should users address questions about the data?
USDA NASS, Spatial Analysis Research SectionAttn: USDA NASS, Spatial Analysis Research Section staff1400 Independence Avenue, SW, Room 5029 South BuildingWashington, District of Columbia 20250-2001
USA800-727-9540 (voice)855-493-0447 (FAX)SM.NASS.RDD.GIB@usda.gov
Why was the data set created?
The purpose of the Cropland Data Layer Program is to use satellite imagery to (1) provide supplemental acreage estimates to the Agricultural Statistics Board for the state's major commodities and (2) produce digital, crop-specific, categorized geo-referenced output products.
How was the data set created?
- From what previous works were the data drawn?
- SENTINEL-2 (source 1 of 14)
-
European Space Agency (ESA), 2023, SENTINEL-2: Copernicus - European Commission, European Commission, Brussels (Belgium).
-
Other_Citation_Details:
The CDL used Sentinel-2 satellite imagery as one of the inputs from 2017-2023. The ESA SENTINEL-2 satellite sensor operates in twelve spectral bands at spatial resolutions varying from 10 to 60 meters. Additional information about the data can be obtained at <http://www.esa.int/>. The imagery was resampled to 30 meters to match Landsat spatial resolution. The resample used cubic convolution, rigorous transformation. Refer to <https://www.nass.usda.gov/Research_and_Science/Cropland/metadata/meta.php> for specific scene date, path, row and quadrants used as classification inputs for each state and year.-
Type_of_Source_Media: online download
Source_Scale_Denominator: 10 meter
Source_Contribution: Raw data used in land cover spectral signature analysis
- Landsat (source 2 of 14)
-
United States Geological Survey (USGS) Earth Resources Observation and Science (EROS), 2023, Landsat TM/ETM/OLI/TIRS: USGS, EROS, Sioux Falls, South Dakota 57198-001.
-
Other_Citation_Details:
The CDL has used Landsat satellite imagery as a primary input throughout the entire history of the program from 1997 to current. The Landsat data are free for download through the following website <https://glovis.usgs.gov/>. Additional information about Landsat data can be obtained at <https://www.usgs.gov/centers/eros>. Refer to <https://www.nass.usda.gov/Research_and_Science/Cropland/metadata/meta.php> for specific sensor, scene date, path and rows used as classification inputs for each state and year.-
Type_of_Source_Media: online download
Source_Scale_Denominator: 30 meter
Source_Contribution: Raw data used in land cover spectral signature analysis
- NED (source 3 of 14)
-
United States Geological Survey (USGS) Earth Resources Observation and Science (EROS) Data Center, 2009, The National Elevation Dataset (NED): USGS, EROS Data Center, Sioux Falls, South Dakota 57198 USA.
-
Other_Citation_Details:
The USGS NED Digital Elevation Model (DEM) is used as an ancillary data source in the production of the Cropland Data Layer. More information on the USGS NED can be found at <https://www.usgs.gov/core-science-systems/national-geospatial-program/national-map>. Refer to the 'Supplemental Information' Section of this metadata file for the complete list of ancillary data sources used as classification inputs.-
Type_of_Source_Media: online
Source_Scale_Denominator: 30 meter
Source_Contribution:spatial and attribute information used in land cover spectral signature analysis - NLCD (source 4 of 14)
-
United States Geological Survey (USGS) Earth Resources Observation and Science (EROS) Data Center, 2021, National Land Cover Database 2019 (NLCD 2019): USGS, EROS Data Center, Sioux Falls, South Dakota 57198 USA.
-
Other_Citation_Details:
The most current publicly available NLCD is used as ground training and validation for non-agricultural categories. Additionally, the USGS NLCD Imperviousness and Tree Canopy Layers were used as ancillary data sources in the Cropland Data Layer classification process. More information on the NLCD can be found at <https://www.mrlc.gov/>. Refer to <https://www.nass.usda.gov/Research_and_Science/Cropland/metadata/meta.php> for the complete list of ancillary data sources used as classification inputs for each state and year.-
Type_of_Source_Media: online
Source_Scale_Denominator: 30 meter
Source_Contribution: Raw data used in land cover spectral signature analysis
- FSA CLU (source 5 of 14)
-
United States Department of Agriculture (USDA) Farm Service Agency (FSA), 2023, USDA, FSA Common Land Unit (CLU): USDA, FSA Aerial Photography Field Office, Salt Lake City, Utah 84119-2020 USA.
-
Other_Citation_Details:
Access to the USDA, Farm Service Agency (FSA) Common Land Unit (CLU) digital data set is currently limited to FSA and Agency partnerships. During the current growing season, producers enrolled in FSA programs report their growing intentions, crops and acreage to USDA Field Service Centers. Their field boundaries are digitized in a standardized GIS data layer and the associated attribute information is maintained in a database known as 578 Administrative Data. This CLU/578 dataset provides a comprehensive and robust agricultural training and validation data set for the Cropland Data Layer. Additional information about the CLU Program can be found at <https://www.fsa.usda.gov/>.-
Type_of_Source_Media: online
Source_Scale_Denominator: 4800
Source_Contribution:spatial and attribute information used in the spectral signature training and validation of agricultural land cover - NCCPI (source 6 of 14)
-
United States Geological Survey (USGS) Earth Resources Observation and Science (EROS) Data Center, 2012, National Commodity Crop Productivity Index (NCCPI) Version 2.0: United States Department of Agriculture, Natural Resources Conservation Service, National Soil Survey Center, Lincoln, Nebraska USA.
-
Other_Citation_Details:
(Michigan only dataset) The NCCPI was used as an ancillary input for the Michigan CDL. The data was resampled to 30 meters for use in CDL production. For more information about the NCCPI: <https://www.nrcs.usda.gov/>.-
Type_of_Source_Media: online
Source_Scale_Denominator: 30 meter
Source_Contribution: Ancillary input used in land cover spectral signature analysis
- LandIQ (source 7 of 14)
-
California Department of Water Resources (DWR), 2023, Statewide Land Use 2021 (Provisional): California Department of Water Resources (DWR), Sacramento, California 94236-0001 USA.
-
Other_Citation_Details:
(California only dataset) The California Department of Water Resources Land Use Program data is used as additional crop-specific ground reference training and validation for tree crops and vineyards in California. More information about California Department of Water Resources Land Use Program can be found online at <https://data.cnra.ca.gov/dataset/statewide-crop-mapping> and <https://www.landiq.com/>.-
Type_of_Source_Media: online
Source_Scale_Denominator: 4800
Source_Contribution:spatial and attribute information used in the spectral signature training and validation of agricultural land cover - LCRAS GIS Data (source 8 of 14)
-
United States Department of Interior, Bureau of Reclamation, Lower Colorado Region, 2023, Lower Colorado River Water Accounting System (LCRAS) GIS data layer: United States Department of Interior, Bureau of Reclamation, Lower Colorado Region, Boulder City, NV 89006-1470, USA.
-
Other_Citation_Details:
(Arizona and California only dataset) The Lower Colorado River Water Accounting System (LCRAS) GIS data layer contains an annually updated record of crop types that was used to supplement the training and validation of the Cropland Data Layer. The area covered is Southern California and Southwest Arizona. For more details, please reference the Bureau of Reclamation website <https://www.usbr.gov/lc/>.-
Type_of_Source_Media: online
Source_Scale_Denominator: 4800
Source_Contribution:spatial and attribute information used in the spectral signature training and validation of agricultural land cover - NASS Citrus Grove Data Layer (source 9 of 14)
-
United States Department of Agriculture (USDA) National Agricultural Statistics Service (NASS), 2023, USDA NASS Citrus Grove Data Layer: USDA NASS Florida Field Office, Maitland, Florida 32751-7057 USA.
-
Other_Citation_Details:
(Florida only dataset) The Citrus Grove Data Layer is used as additional citrus training and validation ground reference data. Access to the USDA National Agricultural Statistics Service (NASS) Citrus Grove Data Layer is unpublished, for internal NASS use only.-
Type_of_Source_Media: online
Source_Scale_Denominator: 4800
Source_Contribution:spatial and attribute information used in the spectral signature training and validation of agricultural land cover - FSAID (source 10 of 14)
-
Florida Department of Agriculture and Consumer Services, 2023, Florida Statewide Agricultural Irrigation Demand (FSAID) Geodatabase: Florida Department of Agriculture and Consumer Services, Tallahassee, Florida 32399-0800 USA.
-
Other_Citation_Details:
(Florida only dataset) The Florida Statewide Agricultural Irrigation Demand (FSAID) Geodatabase provides additional training and validation ground reference for Florida specialty tree crops. More information about this data set can be found online at <https://www.fdacs.gov/Agriculture-Industry/Water/Agricultural-Water-Supply-Planning>.-
Type_of_Source_Media: online
Source_Scale_Denominator: 4800
Source_Contribution:spatial and attribute information used in the spectral signature training and validation of agricultural land cover - Lake Erie Vineyards GIS data (source 11 of 14)
-
Cornell Cooperative Extension, Lake Erie Regional Grape Program, 2023, GIS Mapping of Lake Erie Vineyards: Lake Erie Regional Grape Program at CLEREL - Cornell University, Portland, NY, 14769 USA.
-
Other_Citation_Details:
(New York, Ohio and Pennsylvania only dataset) The Lake Erie Vineyards GIS data provides additional training and validation data for vineyards. More information can be found at <https://lergp.cce.cornell.edu/>.-
Type_of_Source_Media: online
Source_Scale_Denominator: 4800
Source_Contribution:spatial and attribute information used in the spectral signature training and validation of agricultural land cover - none (source 12 of 14)
-
Gordon B. Jones, PhD, and Rick Hilton of Oregon State University; Karim Naguib of the Jackson County GIS Office, unknown, Pear and Vineyard Data for Jackson County, Oregon: unpublished, Central Point, Oregon 97502 USA.
-
Other_Citation_Details:
(Oregon only dataset) The Oregon State University Pear and Vineyard Data for Jackson County, Oregon provides additional tree crop and vineyard training and validation data. Contact Gordon B. Jones at Oregon State University for more information.-
Type_of_Source_Media: online
Source_Scale_Denominator: 4800
Source_Contribution:spatial and attribute information used in the spectral signature training and validation of agricultural land cover - Utah DWR Agriculture Check Polygons (source 13 of 14)
-
Utah Division of Water Resources, 2023, Agriculture Check Polygons: Utah Division of Water Resources, Salt Lake City, Utah 84116 USA.
-
Other_Citation_Details:
(Utah only dataset) The Utah Division of Water Resources Agriculture Check Polygon data provides additional training and validation data for Utah's cropland.-
Type_of_Source_Media: online
Source_Scale_Denominator: 4800
Source_Contribution:spatial and attribute information used in the spectral signature training and validation of agricultural land cover - WSDA Crop Geodatabase (source 14 of 14)
-
Washington State Department of Agriculture (WSDA), 2023, WSDA Crop Geodatabase: Washington State Department of Agriculture, Olympia, WA 98504-2560 USA.
-
Other_Citation_Details:
(Washington only dataset) The WSDA Crop Geodatabase provides additional training and validation data for Washington's orchards, vineyards and small acreage crops. More information about the WSDA Crop Geodatabase can be found at <https://agr.wa.gov/>.-
Type_of_Source_Media: online
Source_Scale_Denominator: 4800
Source_Contribution:spatial and attribute information used in the spectral signature training and validation of agricultural land cover
- How were the data generated, processed, and modified?
- Date: 2023 (process 1 of 1)
-
OVERVIEW: The United States Department of Agriculture (USDA) National Agricultural Statistics Service (NASS) Cropland Data Layer (CDL) Program is a unique agricultural-specific land cover geospatial product that is produced annually in participating states. The CDL Program builds upon NASS' traditional crop acreage estimation program and integrates Farm Service Agency (FSA) grower-reported field data with satellite imagery to create an unbiased statistical estimator of crop area at the state and county level for internal use. It is important to note that the internal CDL acreage estimates, which most closely aligned with planted acres, are not simple pixel counting but regression estimates using NASS survey data. It is more of an 'Adjusted Census by Satellite.'
SOFTWARE: ERDAS Imagine is used in the pre- and post- processing of all raster-based data. ESRI ArcGIS is used to prepare the vector-based training and validation data. Rulequest See5.0 is used to create a decision tree based classifier. The NLCD Mapping Tool is used to apply the See5.0 decision-tree via ERDAS Imagine.
DECISION TREE CLASSIFIER: This Cropland Data Layer uses a decision tree classifier approach. Using a decision tree classifier is a departure from older versions (pre-2007) of the CDL which were created using in-house software (Peditor) based upon a maximum likelihood classifier approach. Decision trees offer several advantages over the more traditional maximum likelihood classification method. The advantages include being: 1) non-parametric by nature and thus not reliant on the assumption of the input data being normally distributed, 2) efficient to construct and thus capable of handling large and complex data sets, 3) able to incorporate missing and non-continuous data, and 4) able to sort out non-linear relationships.
GROUND TRUTH: As with the maximum likelihood method, decision tree analysis is a supervised classification technique. Thus, it relies on having a sample of known ground reference areas in which to train the classifier. Older versions of the CDL (prior to 2006) utilized ground reference from the annual June Agricultural Survey (JAS). Beginning in 2006, the CDL utilizes the very comprehensive ground reference provided from the FSA Common Land Unit (CLU) Program as a replacement for the JAS data. The FSA CLU data have the advantage of natively being in a GIS and containing magnitudes more of field level information. Disadvantages include that it is not truly a probability sample of land cover and has bias toward subsidized program crops. Additional information about the FSA data can be found at <https://www.fsa.usda.gov/>. The most current version of the NLCD is used as non-agricultural training and validation data.
INPUTS: The 2023 CDL has a spatial resolution of 30 meters and was produced using satellite imagery from Landsat 8 and 9 OLI/TIRS and ESA SENTINEL-2A and -2B collected throughout the growing season. Some CDL states used additional ancillary inputs to supplement and improve the land cover classification including the United States Geological Survey (USGS) National Elevation Dataset (NED) and the most current versions of the USGS National Land Cover Database imperviousness and the tree canopy data layers. Agricultural training and validation data are derived from the Farm Service Agency (FSA) Common Land Unit (CLU) Program. The most current version of the NLCD is used as non-agricultural training and validation data. Please visit the CDL metadata webpages at <https://www.nass.usda.gov/Research_and_Science/Cropland/SARS1a.php> to view complete lists of imagery, ancillary inputs and training and validation used for a specific state and year.
ACCURACY: The accuracy of the land cover classifications are evaluated using independent validations data sets generated from the FSA CLU data (agricultural categories) and the NLCD (non-agricultural categories). The Producer's Accuracy is generally 85% to 95% correct for the major crop-specific land cover categories. Please visit the CDL FAQs and metadata webpages at <https://www.nass.usda.gov/Research_and_Science/Cropland/SARS1a.php> to view or download full accuracy reports by state and year.
PUBLIC RELEASE: The USDA NASS Cropland Data Layer is considered public domain and free to redistribute. The official website is <https://www.nass.usda.gov/Research_and_Science/Cropland/SARS1a.php>. The data is available free for download through CroplandCROS <https://croplandcros.scinet.usda.gov/> and the Geospatial Data Gateway <https://datagateway.nrcs.usda.gov/>. Please note that in no case are farmer reported data revealed or derivable from the public use Cropland Data Layer.
Person who carried out this activity:
USDA NASS, Spatial Analysis Research SectionAttn: USDA NASS, Spatial Analysis Research Section staff1400 Independence Avenue, SW, Room 5029 South BuildingWashington, District of Columbia 20250-2001
USA800-727-9540 (voice)855-493-0447 (FAX)SM.NASS.RDD.GIB@usda.gov
- What similar or related data should the user be aware of?
How reliable are the data; what problems remain in the data set?
- How well have the observations been checked?
Below are the Overall Accuracy metrics for the crop-specific categories for the Continental United States 2016 to 2023 CDLs. Full accuracy reports for past years, states, and individual crop types are available at the official NASS metadata website noted above.2023 Cropland Data Layer 81.6% OVERALL CROP ACCURACY, 18.4% ERROR, 0.788 KAPPA 2022 Cropland Data Layer 80.9% OVERALL CROP ACCURACY, 19.1% ERROR, 0.780 KAPPA 2021 Cropland Data Layer 81.6% OVERALL CROP ACCURACY, 18.4% ERROR, 0.787 KAPPA 2020 Cropland Data Layer 81.3% OVERALL CROP ACCURACY, 18.7% ERROR, 0.786 KAPPA 2019 Cropland Data Layer 81.5% OVERALL CROP ACCURACY, 18.5% ERROR, 0.789 KAPPA 2018 Cropland Data Layer 82.3% OVERALL CROP ACCURACY, 17.7% ERROR, 0.796 KAPPA 2017 Cropland Data Layer 82.2% OVERALL CROP ACCURACY, 17.8% ERROR, 0.800 KAPPA 2016 Cropland Data Layer 79.6% OVERALL CROP ACCURACY, 20.4% ERROR, 0.767 KAPPA
The accuracy of the non-agricultural land cover classes within the Cropland Data Layer is entirely dependent upon the USGS, National Land Cover Database. Thus, the USDA NASS recommends that users consider the NLCD for studies involving non-agricultural land cover. For more information on the accuracy of the NLCD please reference <https://www.mrlc.gov/>. - How accurate are the geographic locations?
The Cropland Data Layer retains the spatial attributes of the input imagery. The Landsat 8 and 9 OLI/TIRS imagery is obtained via download from the USGS Global Visualization Viewer <https://glovis.usgs.gov/> using the Collection 2 Level-1 specifications. Please reference the metadata on the Glovis website for the positional accuracy of each Landsat scene. The Sentinel 2A and 2B imagery is obtained via download from the Copernicus Open Access Hub <https://scihub.copernicus.eu/> using the S2MSI1C product type which is orthorectified Top-of-Atmosphere reflectance. Please reference the metadata on the Copernicus website for positional accuracy details. - Where are the gaps in the data? What is missing?
Continental US coverage (2008 to current), partial US coverage (1997-2007) - How consistent are the relationships among the observations, including topology?
The Cropland Data Layer (CDL) has been produced using training and independent validation data from the Farm Service Agency (FSA) Common Land Unit (CLU) Program and United States Geological Survey (USGS) National Land Cover Database (NLCD). More information about the FSA CLU Program can be found at <https://www.fsa.usda.gov/>. More information about the NLCD can be found at <https://www.mrlc.gov/>.
How can someone get a copy of the data set?
Are there legal restrictions on access or use of the data?Access_Constraints: none
Use_Constraints:The USDA NASS Cropland Data Layer and the data offered on the CroplandCROS website is provided to the public as is and is considered public domain and free to redistribute. The USDA NASS does not warrant any conclusions drawn from these data.
- Who distributes the data set?
USDA NASS Customer ServiceAttn: USDA NASS Customer Service Staff1400 Independence Avenue, SW, Room 5038-SWashington, District of Columbia 20250-2001
USA800-727-9540 (voice)855-493-0447 (FAX)SM.NASS.RDD.GIB@usda.gov-
Contact_Instructions:
Please visit the official website <https://www.nass.usda.gov/Research_and_Science/Cropland/SARS1a.php> for distribution details. The Cropland Data Layer is available free for download at CroplandCROS <https://croplandcros.scinet.usda.gov/> and the Geospatial Data Gateway <https://datagateway.nrcs.usda.gov/>. Distribution issues can also be directed to the NASS Customer Service Hotline at 1-800-727-9540. - What's the catalog number I need to order this data set? 2023 Cropland Data Layer
- What legal disclaimers am I supposed to read?
Disclaimer: Users of the Cropland Data Layer (CDL) are solely responsible for interpretations made from these products. The CDL is provided 'as is' and the USDA NASS does not warrant results you may obtain using the Cropland Data Layer. Contact our staff at (SM.NASS.RDD.GIB@usda.gov) if technical questions arise in the use of the CDL. NASS maintains a Frequently Asked Questions (FAQ's) section at <https://www.nass.usda.gov/Research_and_Science/Cropland/SARS1a.php>.
- How can I download or order the data?
- Availability in digital form:
Data format: GEOTIFF in format GEOTIFF Network links: <https://croplandcros.scinet.usda.gov/>
- Cost and order instructions:
The CDL is available online and free for download at CroplandCROS <https://croplandcros.scinet.usda.gov/>, the Geospatial Data Gateway <https://datagateway.nrcs.usda.gov/>, and the NASS CDL website <https://www.nass.usda.gov/Research_and_Science/Cropland/Release/>. Distribution questions can be directed to the NASS Customer Service Hotline at 1-800-727-9540.
- Availability in digital form:
- What hardware or software do I need in order to use the data set?
If the user does not have software capable of viewing GEOTIF (.tif) file formats then we suggest using CroplandCROS <https://croplandcros.scinet.usda.gov/>.
Who wrote the metadata?
- Metadata in various formats availabe at Data.Gov
Metadata Standard: ISO 19115-3Metadata Standard: ISO 19139- Dates:
- Last modified: 31-Jan-2024
- Metadata author:
-
USDA NASS, Spatial Analysis Research SectionAttn: USDA NASS, Spatial Analysis Research Section Staff1400 Independence Avenue, SW, Room 5029 South BuildingWashington, District of Columbia 20250-2001
USA800-727-9540 (voice)855-493-0447 (FAX)SM.NASS.RDD.GIB@usda.gov - Metadata standard:
- FGDC Content Standards for Digital Geospatial Metadata (FGDC-STD-001-1998)
CDL PROGRAM HISTORY
- How has the CDL Program changed over time?
Originally, field preparation and digitizing work were performed in NASS Field Offices and the remote sensing analysis performed by the Spatial Analysis Research Section (SARS) of NASS. However, in 1997 SARS entered into a data sharing partnership with USDA's Foreign Agricultural Service and USDA's Farm Service Agency. The agreement provided access to Landsat 5 coverage in the states selected for the project by SARS. The first states covered with the data sharing partnership were Arkansas, North Dakota and South Dakota. Improvements in hardware along with software enhancements made program expansion possible for the 1999 growing season. NASS Research Development Division solicited additional states to find outside cooperators/partners to provide an analyst and hardware to perform duties associated with the Acreage Estimation Program. The Illinois and Mississippi State Field Offices were able to obtain partnership agreements with external State/Federal Agencies.
For crop year 2000, the states of Iowa and Indiana were added to the Program. North Dakota was able to obtain a partner for the 2000 crop year cooperatively with North Dakota State University (NDSU) through an EPA water quality grant for 5 years. Indiana was added to the program for crop year 2000 also, but as a regional type center where the ground data collection and digitization was performed at the Indiana State Office, and the acreage estimation was performed at the Illinois State Office.
For crop year 2001, the Missouri southeastern boot heel area was added to the program. All boot heel digitizing was performed by the Missouri Ag Statistics Service, and image processing duties were performed by the Arkansas Ag Statistical Service. Nebraska and Wisconsin were added as pilot states, where all digitizing was performed by the Nebraska and Wisconsin Ag Statistics Service offices respectively, and image processing functions were performed by SARS. Maryland/Delaware were also added as a pilot program where digitizing was done by the University of Maryland Mid-Atlantic RESAC group, and image processing was performed by the SARS group.
For crop year 2002, Nebraska expanded to full state coverage, and Wisconsin expanded to full state coverage in 2003. In 2002, a ten state Mid-Atlantic based Cropland Data Layer product was sponsored in part by a NASA/Raytheon/Synergy Project through Towson University, with the digitizing and image analysis performed under contract by NASS. The Mid-Atlantic CDL products were based on the 2002 June Agricultural Survey and the Agriculture Coverage Evaluation Survey (ACES) that coincided with the 2002 Agricultural Census.
For crop year 2004, the IRS Resourcesat-1 AWiFS sensor was used over Nebraska, Indiana and Arkansas to perform acreage analysis. The AR, IN and NE CDL's were released with both Landsat TM classifications as well as AWiFS classifications. The AWiFS sensor has 56 meter spatial resolution, and five day repeat coverage. The best possible scene dates taken during the month of August 2004 were used to create the AWiFS CDL products. A cooperative partnership between University of Maryland Department of Geography and SARS helped process the Louisiana 2004 CDL. A Florida CDL for 2004 was released in February of 2007 using Landsat 5/7 imagery. The Florida CDL was the first CDL created exclusively with See5, and it was the first usage of the segmentation based gap filled Landsat-7 SLC-off imagery. It included the first usage of the Farm Service Agency/Common Land Unit and the Florida Citrus Grove layer for ground truth training.
For crop year 2005, the Idaho Cropland Data Layer was created with a cooperative partnership between Utah State University, the United Potato Growers of Idaho and NASS. This partnership produced both a Landsat TM and Resourcesat-1 AWiFS classification over the Idaho Snake River Plain. The 2005 Midwestern CDL update contained new AWiFS classifications and a revised Wisconsin TM based classification. The new AWiFS classifications cover Nebraska and North Dakota. The Wisconsin revision was performed under contract for the Wisconsin State, Bureau of Environmental and Occupational Health and Department of Health and Family Services. The 2005 Mississippi Delta Region was classified using the regression tree classifier See5.0 available from www.rulequest.com over the 2001 NLCD defined mapping Zone 45 https://www.mrlc.gov/ for the States of Arkansas, Louisiana and Missouri. The Zone 45 classification results from See5.0 were overlaid on top of the Arkansas, Louisiana and Missouri bootheel, resulting in an accurate ag classification and an enhanced non-ag land cover classification leveraging results from the 2001 NLCD products. The traditional pixel based PEDITOR classification covers the remaining parts of these states.
The 2006 Delta/Midwestern/Pacific Northwest CDL products covered eleven states: AR, IL, IN, IA, LA, MO, MS, NE, ND, WA, WI. Illinois and Indiana were processed with Peditor. The remaining States were processed using See5 decision tree software. The Mississippi Delta CDL and the remaining Midwestern and Prairie States were processed exclusively with See5 using the FSA Common Land Unit for ground truth. The 2006 Washington CDL does have a smoothing algorithm applied to remove pixel scatter. This is the only state and year of CDL that has any level of post-classification smoothing.
The 2007 CDL product became operational in NASS delivering for the first time in-season acreage estimates for the October 2007 Crop Report across all speculative corn and soybean states. Twenty-one states total (AR, CA, IL, IN, IA, ID, KS, LA, MI, MN, MO, MS, MT, ND, NE, OH, OK, OR, SD, WA, WI) were processed into CDL's. Additionally, new CDL's were created for crop year 2006 for KS, MN, MO, OH, OK, SD. Michigan State University/Land Policy Institute entered into a cooperative partnership with SARS and obtained funding to provide an image analyst to process Michigan.
The 2008 crop year is the first year that the entire Continental United States is covered by the CDL. Real-time CDL acreage estimates were produced for the June Ag Survey for winter wheat, the August Crop Report and the October Crop Report for corn and soybeans. The 2008 CDL was reprocessed and released on 12/11/2017. The 2008 and 2009 Cropland Data Layers (CDL) for the entire Continental United States have been reprocessed and re-released at a 30 meter spatial resolution. The move from 56m to 30m resolution was made possible with the inclusion of Landsat 5 Thematic Mapper data, which was not freely available during the initial processing period. Additionally, the reprocessing effort used more complete Farm Service Agency administrative data for training and accuracy assessing the classifications.
The 2009 crop year again covered the entire continental United States and produced real-time CDL acreage estimates for the June Ag Survey and September Small Grain Summary for winter wheat, the August, September and October Crop Reports for corn, soybeans, rice and cotton. The original 2009 product was released at 56 meters resolution but was re-released as a 30 meter product on 12/11/2017.
The 2008 and 2009 CDLs were reprocessed and re-released on 12/11/2017 for the entire Continental United States at a 30 meter spatial resolution. The move from 56m to 30m resolution was made possible with the inclusion of Landsat 5 Thematic Mapper data, which was not freely available during the initial processing period. Additionally, the reprocessing effort used more complete Farm Service Agency administrative data for training and accuracy assessing the classifications.
The 2010 CDL product was released the first week of January 2011 co-incident with the release of the new CropScape web service. The 2010 product utilized Landsat TM/ETM+ and AWiFS imagery for production of a 30m product covering the Continental United States.
The 2011 CDL product was released January 31, 2012. The 2011 product utilized Deimos-1, UK-DMC 2, Landsat TM/ETM+, and AWiFS imagery for production of a 30m product covering the Continental United States. Coincident with the release of the 2011 product, the entire historical CDL catalog was re-released with minor category code and class name revisions. These revisions were done to eliminate redundant or unused categories. Please view the 2011 crosswalk document for a detailed listing of the revisions.
The 2012 CDL product was released January 31, 2013. The 2012 product utilized Deimos-1, UK-DMC 2, and Landsat TM/ETM+ imagery for production of a 30m product covering the Continental United States.
The 2013 CDL product was released January 31, 2014. The 2013 product utilized Deimos-1, UK-DMC 2, and Landsat 8 imagery for production of a 30m product covering the Continental United States. Coincident with the release of the 2013 product, the entire historical CDL catalog was re-released with minor category code and class name revisions. These revisions were done to eliminate redundant or unused categories. Please view the 2013 crosswalk document for a detailed listing of the revisions.
The 2014 CDL product was released February 2, 2015. The 2014 CDL product utilized Deimos-1, UK-DMC 2, and Landsat 8 imagery for production of a 30m product covering the Continental United States.
The 2015 CDL product was released February 12, 2016. The 2015 CDL product utilized Deimos-1, UK-DMC 2, and Landsat 8 imagery for production of a 30m product covering the Continental United States.
The 2016 CDL product was released February 3, 2017. The 2016 CDL product utilized Deimos-1, UK-DMC 2, and Landsat 8 imagery for production of a 30m product covering the Continental United States. Beginning with the 2016 CDL season we are creating CDL accuracy assessments using unbuffered validation data. These "unbuffered" accuracy metrics will now reflect the accuracy of field edges which have not been represented previously. This admission of modestly inflated accuracy measures does not render past assessments useless. By providing both buffered and unbuffered validation scenarios for 2016 gives guidance on the bias. There are no plans to create unbuffered accuracy assessments for prior CDL seasons.
The 2017 CDL product was released January 26, 2018. The 2017 CDL product utilized satellite imagery from the Landsat 8 OLI/TIRS sensor, the Disaster Monitoring Constellation (DMC) DEIMOS-1 and UK2, the ISRO ResourceSat-2 LISS-3, and the ESA SENTINEL-2 sensors collected during the current growing season. The spatial resolution is 30 meters covering the Continental United States.
The 2018 CDL product was released February 15, 2019. The 2018 CDL product utilized satellite imagery from the Landsat 8 OLI/TIRS sensor, the Disaster Monitoring Constellation (DMC) DEIMOS-1 and UK2, the ISRO ResourceSat-2 LISS-3, and the ESA SENTINEL-2 sensors collected during the current growing season. The spatial resolution is 30 meters covering the Continental United States. A new CDL category was added in 2018, Code 215 - Avocados.
The 2019 CDL product was released February 5, 2020. The 2019 CDL product utilized satellite imagery from the Landsat 8 OLI/TIRS sensor, the Disaster Monitoring Constellation (DMC) DEIMOS-1 and UK2, the ISRO ResourceSat-2 LISS-3, and the ESA SENTINEL-2 sensors collected during the current growing season. The spatial resolution is 30 meters covering the Continental United States. The 2007-2018 CDLs used FSA CLU data for agricultural training with a 30 meter inward buffer applied. The inward buffering removes spectrally mixed field edge pixels from the land cover classifier. Starting with the 2019 CDL products, the inward buffer has been reduced from 30 meters to 15 meters. The result is a noticeable increase in crop identification at field borders which impacts the CDL, the Cultivated Layer, and Crop Frequency Layers. The newly published USGS NLCD 2016 was used as training for the non-agricultural component of the 2019 CDL. A new CDL category was added in 2019, Code 228 - Double-Cropped Triticale/Corn.
The 2020 CDL product was released February 1, 2021. The 2020 CDL product utilized satellite imagery from the Landsat 8 OLI/TIRS sensor, the Disaster Monitoring Constellation (DMC) DEIMOS-1, the ISRO ResourceSat-2 LISS-3, and the ESA SENTINEL-2 sensors collected during the current growing season. The spatial resolution is 30 meters covering the Continental United States. There were no new CDL categories added in 2020.
The 2021 CDL product was released February 14, 2022. The 2021 CDL product utilized satellite imagery from the Landsat 8 OLI/TIRS sensor, the ISRO ResourceSat-2 LISS-3, and the ESA SENTINEL-2 sensors collected during the current growing season. The spatial resolution is 30 meters covering the Continental United States. There were no new CDL categories added in 2021.
The 2022 CDL product was released January 30, 2023. The 2022 CDL product utilized satellite imagery from the Landsat 8 and Landsat 9 OLI/TIRS sensors, the ISRO ResourceSat-2 LISS-3, and the ESA SENTINEL-2A and -2B sensors collected during the current growing season. The spatial resolution is 30 meters covering the Continental United States. There were no new CDL categories added or changes in processing methodology in 2022.
The 2023 CDL product was released January 31, 2024. The 2023 CDL product utilized satellite imagery from the Landsat 8 and Landsat 9 OLI/TIRS sensors and the ESA SENTINEL-2A and -2B sensors collected during the current growing season. The spatial resolution is 30 meters covering the Continental United States. There were no new CDL categories added or changes in processing methodology in 2023. - How has the methodology used to create the CDL changed over the program's history?
The classification process used to create older CDLs (prior to 2006) was based on a maximum likelihood classifier approach using in-house software. The pre-2006 CDL's relied primarily on satellite imagery from the Landsat TM/ETM satellites which had a 16-day revisit. The in-house software limited the use of only two scenes per classification area. The only source of ground truth was the NASS June Area Survey (JAS). The JAS data is collected by field enumerators so it is quite accurate but is limited in coverage due to the cost and time constraints of such a massive annual field survey. It was also very labor intensive to digitize and label all of the collected JAS field data for use in the classification process. Non-agricultural land cover was based on image analyst interpretations.
Starting in 2006, NASS began utilizing a new satellite sensor, new commercial off-the-shelf software, more extensive training/validation data. The in-house software was phased out in favor of a commercial software suite, which includes Erdas Imagine, ESRI ArcGIS, and Rulequest See5. This improved processing efficiency and, more importantly, allowed for unlimited satellite imagery and ancillary dataset inputs. The new source of agricultural training and validation data became the USDA Farm Service Agency (FSA) Common Land Unit (CLU) Program data which was much more extensive in coverage than the JAS and was in a GIS-ready format. NASS also began using the most current USGS National Land Cover Dataset (NLCD) dataset to train over the non-agricultural domain. The new classification method uses a decision tree classifier.
NASS continues to strive for CDL processing improvements, including our handling of the FSA CLU pre-processing and the searching out and inclusion of additional agricultural training and validation data from other State, Federal, and private industry sources. New satellite sensors are incorporated as they become available. Currently, the CDL Program uses the Landsat 8 and 9 OLI/TIRS sensor, the Disaster Monitoring Constellation (DMC) DEIMOS-1 and UK2, the ISRO ResourceSat-2 LISS-3, and the ESA SENTINEL-2 A and B sensors. Imagery is downloaded daily throughout the growing season with the objective of obtaining at least one cloud-free usable image every two weeks throughout the growing season.
Common User Questions
- Is the Cropland Data Layer available in a shapefile format?
We do not offer the data in a vector format, such as shapefile. The CDL data can be downloaded in a raster-based GeoTIFF file format and used in most common GIS software. In ESRI ArcGIS you would most likely require the 'Spatial Analyst' extension to perform any in-depth GIS applications using the GeoTIFF file. And any common image processing software, such Erdas Imagine, ENVI or PCI, should be able to perform basic image processing/GIS applications using the GeoTIFF file. This type of pixel-based data does not lend itself to being converted to vector since the resulting polygon file would be enormous. Depending on the size of area you are studying it is technically possible to convert CDL data to a shapefile, but it would have to be a rather small area such as a single county or smaller.
If you do convert the data to a shapefile format and want to add the CDL category names in ESRI ArcGIS, then start by downloading this spreadsheet file cdl_codes_names.xlsx that lists all CDL codes and category names. Open this file and change the "Code" column header to match the name of the attribute field in your newly created shapefile. Then open both the excel file and the shapefile in ArcGIS. Right click on the shapefile in the ArcGIS Table of Contents and do a JOIN on the commonly named "code" attribute field. You can then right click on the shapefile and use Data > Export Data to save a new shapefile with the category names added. - What differences can be expected when comparing CDL-based acreage and official NASS statistics?
Users should be aware of the potential limitations of acreage summaries that are based on only pixel counting. Most land cover classification datasets will contain some level of counting bias (typically downward). Pixel counting is usually downward biased when compared to the official estimates. Counting pixels and multiplying by the area of each pixel will result in biased area estimates and should be considered raw numbers needing bias correction. Official crop acreage estimates at the state and county level are available at QuickStats.
Here are a list of references discussing the subject matter of pixel counting and estimation:
a) Gallego F.J., 2004, Remote sensing and land cover area estimation. International Journal of Remote Sensing. Vol. 25, n. 15, pp. 3019-3047.
b) European Commission, Joint Research Centre, MARS; Best practices for crop area estimation with Remote Sensing - Section 4.1.1.
c) Czaplewski, R. L. (1992). Misclassification bias in areal estimates. Photogrammetric Engineering and Remote Sensing, 58, 189-192. - What projections are used?
CDL data use USA Contiguous Albers Equal Area Conic USGS Version with a spheroid of GRS 1980 and datum of NAD83. The downloadable zip files from the SARS website are offered in the native Albers projection. Please notice that this projection has an offset from the standard North America Albers Equal Area Conic in standard parallels. The projection information is as follows (in human-readable OGC WKT):
PROJCS["NAD_1983_Albers",
GEOGCS["NAD83",
DATUM["North_American_Datum_1983",
SPHEROID["GRS 1980",6378137,298.257222101,
AUTHORITY["EPSG","7019"]],
TOWGS84[0,0,0,0,0,0,0],
AUTHORITY["EPSG","6269"]],
PRIMEM["Greenwich",0,
AUTHORITY["EPSG","8901"]],
UNIT["degree",0.0174532925199433,
AUTHORITY["EPSG","9108"]],
AUTHORITY["EPSG","4269"]],
PROJECTION["Albers_Conic_Equal_Area"],
PARAMETER["standard_parallel_1",29.5],
PARAMETER["standard_parallel_2",45.5],
PARAMETER["latitude_of_center",23],
PARAMETER["longitude_of_center",-96],
PARAMETER["false_easting",0],
PARAMETER["false_northing",0],
UNIT["meters",1]]
In order to conform to Geospatial Data Gateway technical specifications, any CDL data downloaded through the Geospatial Data Gateway is re-projected from Albers to the dominant Universal Transverse Mercator (UTM) zone with a spheroid and datum of WGS84. The one exception to the UTM projection is for Wisconsin. Wisconsin is projected using the Wisconsin Transverse Mercator (WTM) projection. This WTM projection is based on the 1991 adjustment to NAD83, and is called WTM83/91. Projection parameters and additional information about WTM83/91 is posted on the DNR website: http://dnr.wi.gov/maps/gis/wtm8391.html
WTM83/91 Parameters
Projection: Transverse Mercator
Scale Factor at Central Meridian: 0.9996
Longitude of Central Meridian: 90 Degrees West (-90 Degrees)
Latitude of Origin: 0 Degrees
False Easting: 520,000
False Northing: -4,480,000
Unit: Meter
Horizontal Datum: NAD83, 1991 Adjustment (aka HPGN or HARN) - Are color legends available for the Cropland Data Layers?
The following downloadable jpeg files are color legends by year for the Continental United States CDLs:
US_2023_CDL_legend.jpg
US_2022_CDL_legend.jpg
US_2021_CDL_legend.jpg
US_2020_CDL_legend.jpg
US_2019_CDL_legend.jpg
US_2018_CDL_legend.jpg
US_2017_CDL_legend.jpg
US_2016_CDL_legend.jpg
US_2015_CDL_legend.jpg
US_2014_CDL_legend.jpg
US_2013_CDL_legend.jpg
US_2012_CDL_legend.jpg
US_2011_CDL_legend.jpg
US_2010_CDL_legend.jpg
US_2009_CDL_legend.jpg
US_2008_CDL_legend.jpg - Has someone compiled all of the exported CDL attribute tables by year and state into a master spreadsheet?
2023_CDL_Histogram_Summary.xlsx
2022_CDL_Histogram_Summary.xlsx
2021_CDL_Histogram_Summary.xlsx
2020_CDL_Histogram_Summary.xlsx
2019_CDL_Histogram_Summary.xlsx
2018_CDL_Histogram_Summary.xlsx
2017_CDL_Histogram_Summary.xlsx
2016_CDL_Histogram_Summary.xlsx
2015_CDL_Histogram_Summary.xlsx
2014_CDL_Histogram_Summary.xlsx
2013_CDL_Histogram_Summary.xlsx
2012_CDL_Histogram_Summary.xlsx
2011_CDL_Histogram_Summary.xlsx
2010_CDL_Histogram_Summary.xlsx
2009_CDL_Histogram_Summary.xlsx
2008_CDL_Histogram_Summary.xlsx - Has someone summarized CDL acreage for all land cover categories at the county-level for the Continental United States?
Below is a link to a WinZIP file containing CSV spreadsheets that summarize the pixel counts and acreage for all US counties for each CDL land cover category beginning with the year 2007 to current. These are raw pixel counts and are not official NASS estimates. The yearly CDL pixel counts and acreage county summaries are available at County_Pixel_Count.zip.
- Is more detailed accuracy assessment information available than what is provided in the metadata? Can you provide the full accuracy assessment error/confusion matrices for all states?
The strength and emphasis of the CDL is crop-specific land cover categories. The accuracy of the CDL non-agricultural land cover classes is entirely dependent upon the USGS, National Land Cover Database (NLCD). Thus, the USDA, NASS recommends that users consider the NLCD for studies involving non-agricultural land cover.
The training and validation data used to create and accuracy assess the CDL has traditionally been based on ground truth data that is buffered inward 30 meters. This was done 1) because satellite imagery (as well as the polygon reference data) in the past was not georeferenced to the same precision as now (i.e. everything "stacked" less perfectly), 2) to eliminate from training spectrally-mixed pixels at land cover boundaries, and 3) to be spatially conservative during the era when coarser 56 meter AWiFS satellite imagery was incorporated. Ultimately, all of these scenarios created "blurry" edge pixels through the seasonal time series which it was found if ignored from training in the classification helped improve the quality of CDL. However, the accuracy assessment portion of the analysis also used buffered data meaning those same edge pixels were not assessed fully with the rest of the classification. This would be inconsequential if those edge pixels were similar in nature to the rest of the scene but they are not as they tend to be more difficult to classify correctly. Thus, the accuracy assessments as have been presented are inflated somewhat.
Beginning with the 2016 CDL season we are creating CDL accuracy assessments using unbuffered validation data. These "unbuffered" accuracy metrics will now reflect the accuracy of field edges which have not been represented previously. This admission of modestly inflated accuracy measures does not render past assessments useless. By providing both buffered and unbuffered validation scenarios for 2016 gives guidance on the bias. There are no plans to create unbuffered accuracy assessments for prior CDL seasons.
The full error matrices are included in the downloadable links below.CDL_2023_accuracy_assessments.zip
CDL_2022_accuracy_assessments.zip
CDL_2021_accuracy_assessments.zip
CDL_2020_accuracy_assessments.zip
CDL_2019_accuracy_assessments.zip
CDL_2018_accuracy_assessments.zip
CDL_2017_accuracy_assessments.zip
CDL_2016_accuracy_assessments.zip
CDL_2015_accuracy_assessments.zip
CDL_2014_accuracy_assessments.zip
CDL_2013_accuracy_assessments.zip
CDL_2012_accuracy_assessments.zip
CDL_2011_accuracy_assessments.zip
CDL_2010_accuracy_assessments.zip
CDL_2009_accuracy_assessments.zip
CDL_2008_accuracy_assessments.zip - NASS says this is a Cropland data layer product, what about the areas that are not agriculturally intensive?
The strength of the CDL is in its agricultural classifications. The major crop types for a CDL state will normally have a classification accuracy of 85% to 95%.
Prior to 2006, the field level training data was collected solely through the June Agricultural Survey (JAS). The JAS is an annual national survey of randomly selected areas of land. The selected areas are targeted toward cultivated parts of each state based on its area frame. Our enumerators are given questionnaires to ask the farmers what, where, when and how much are they planting. Our surveys focus on cropland, but the enumerators record all land covers within the sampled area of land whether it is cropland or not. NASS uses broad land use categories to define land that is not under cultivation, including; non-agricultural, pasture/rangeland, waste, woods, and farmstead making it difficult to know what specific type of land use/cover actually is on the ground. Thus, non-agricultural land cover contained within the 2005 and older CDL products were based solely on an individual analyst's interpretation.
Newer CDLs (2006 to current) use agricultural training and validation data provided by the FSA CLU Program. The FSA CLU data does not contain much, if any, non-agricultural data. The only source of non-ag training available at the scale required to meet the needs of the CDL Program is the USGS National Land Cover Dataset (NLCD). We sample the non-ag categories of the NLCD proportionate to the available FSA CLU data for a state and include this in the CDL classification process. Thus, the accuracy of the non-agricultural land cover classes within the Cropland Data Layer are entirely dependent upon the NLCD. We recommend that users consider the NLCD for studies involving non-agricultural land cover.
The FSA CLU data does contain a small amount of non-agricultural data and this non-ag FSA data was used in the classification process in early versions of the CDL. Thus, there are some CDL states that may have multiple categories for the same non-ag land cover type, such as category 87 (FSA-sampled wetland) and category 190 and 195 (NLCD-sampled wetlands). This is should only be an issue in the 2006 and 2007 CDL products. Beginning in 2008, the use of the FSA CLU non-ag for classification training was discontinued. Beginning with the 2013 CDL, the use of FSA-sampled grasses and pasture (code 62) was discontinued.
- Are more detailed CDL category definitions available?
The AGRICULTURAL CATEGORIES are based on data from the Farm Service Agency (FSA) Common Land Unit (CLU) Program. Thus, all crop specific categories are determined by the FSA CLU/578 Program which offers detailed documentation at the following website: https://www.fsa.usda.gov/programs-and-services/laws-and-regulations/handbooks/index. The online manual titled 2-CP contains much of the crop information used for CDL purposes, especially the Section titled "Exhibit 10 2003 and Subsequent Year Crops Reported on FSA-578." There are hundreds of potential FSA crop types and thousands of other variables that we have done our best to crosswalk for CDL purposes. This Microsoft Excel spreadsheet FSA-to-CDL_Crosswalk details our current crosswalking and can be used to determine exactly what FSA crop types appear within grouped CDL categories, such as "Other Crops" (CDL code 44), "Misc Vegs and Fruit" (CDL code 47), "Herbs" (CDL code 57), "Other Tree Crops" (CDL code 71), and "Greens" (CDL code 219).
The NON-AGRICULTURAL CATEGORIES in the CDL are derived from the most current publicly available USGS National Land Cover Database (NLCD). The non-ag NLCD categories are sampled for training the classification and for validation. The NLCD legend with category definitions is available at: https://www.mrlc.gov/data/legends/national-land-cover-database-2016-nlcd2016-legend. In the CDL we have added 100 to their code numbers (i.e. NLCD code 11 "Open Water" is code 111 in the CDL). The NLCD Cultivated Crops category is ignored for CDL purposes. We have also made the decision to merge NLCD "Grassland/Herbaceous" and NLCD "Pasture/Hay" into a single CDL category called "Grassland/Pasture" (CDL code 176). - Does the CDL differentiate between grassland types such as urban grassland, pastures used for grazing, and other grass-related land cover types?
Unfortunately, the pasture and grass-related land cover categories have traditionally had very low classification accuracy in the CDL. Moderate spatial and spectral resolution satellite imagery is not ideal for separating grassy land use types, such as urban open space versus pasture for grazing versus CRP grass. To further complicate the matter, the pasture and grass-related categories were not always classified definitionally consistent from state to state or year to year. In an effort to eliminate user confusion and category inconsistencies the 1997-2013 CDLs were recoded and re-released in January 2014 to better represent pasture and grass-related categories. A new category named Grass/Pasture (code 176) collapses the following historical CDL categories: Pasture/Grass (code 62), Grassland Herbaceous (code 171), and Pasture/Hay (code 181). We continue to search for program enhancements and ancillary datasets that may help improve the identification of grassland and pasture categories within the CDL. We recommend users consider using the USGS NLCD (https://www.mrlc.gov/) for research involving non-agricultural categories and grassland/pasture categories.
- How are fields with multiple crop types planted in the same season handled in the Cropland Data Layer, such as winter wheat followed by soybeans?
The primary focus of the Cropland Data Layer (CDL) is large area summer crops. The Farm Service Agency CLU data is the primary source of agricultural training data for the CDL classifier. We depend on the data that the farmer reports on their FSA CLU/578 signup forms. The FSA ground reference is prepared to indicate whether a single or double crop was planted in a particular field. For example, a winter wheat field planted in the Fall of 2009 will be identified in the 2010 CDL, as we consider the time of harvest as the current year of production. If the field is multi-use during a given year, for example winter wheat (ww) followed by soybeans (sb), then a double cropping situation exists and the category for that given field will be winter wheat/soybeans, and is labeled as such in the legend. If a field is only soybeans during that year, then it will be identified as soybeans only. Therefore, all major crop rotations/patterns are captured with this method and are consider mutually exclusive for a given pixel/field. The CDL Program is currently not equipped to monitor triple or quad cropping practices.
- Have the attribute names, codes, and/or colors changed over the history of the program?
All category codes, class names and legend colors are standardized and consistent for all states and all years of the Cropland Data Layer Program.
The 1997-2013 CDLs were recoded and re-released January 31, 2014 to better represent pasture and grass-related categories. A new category named Grass/Pasture (code 176) collapses the following historical CDL categories: Pasture/Grass (code 62), Grassland Herbaceous (code 171), and Pasture/Hay (code 181). This was done to eliminate confusion among these similar land cover types which were not always classified definitionally consistent from state to state or year to year and frequently had poor classification accuracies. Please view the 2013 crosswalk document for a detailed listing of the revisions.
This follows the recoding of the entire CDL archive in January 2012 to better align the historical CDLs with the current product. These revisions were done to eliminate redundant and/or unused categories. The majority of the changes apply to the non-agricultural domain. Please view the 2011 crosswalk document for a detailed listing of the revisions. - How do I add class names and/or histogram values to the GeoTIFF file when viewing the CDL in ESRI ArcGIS Software?
If your downloaded CDL .tif file does not contain category names, then you can add them using the following instructions. Download the file: generic_cdl_attributes.tif.vat.dbf. This generic file contains all possible CDL colors and category names. As long as the .tif file and the .tif.vat.dbf file have the same file name, then the category names will load automatically in ArcMap. So, change the file name (not extension) of the generic_cdl_attributes.tif.vat.dbf to match the file name of the downloaded CDL .tif file. Then add the .tif file as a layer in ArcMap. The category names will display in the Table of Contents window.
Example 1 - If the downloaded .tif file is: _NASS_DATA_CACHE_CDL_2011_clip_20110307142903_862761787.tif Change the generic_cdl_attributes.tif.vat.dbf file name to: _NASS_DATA_CACHE_CDL_2011_clip_20110307142903_862761787.tif.vat.dbf
Example 2 - If you renamed the downloaded .tif file to MyCDL.tif, then rename the generic_cdl_attributes.tif.vat.dbf file name to MyCDL.tif.vat.dbf.
To create a pixel "count" field in the attribute table of the downloaded CDL use the "Build Raster Attribute Table" Function in ESRI ArcGIS. In ESRI ArcGIS Version 9.3 and 10 this function is located at ArcToolbox > Data Management Tools > Raster > Raster Properties > Build Raster Attribute Table. Specify the downloaded CDL tif file as the Input Raster and accept all other defaults and click OK. After it has run successfully, a new "Count" data field is added to the attribute table. Count represents a raw pixel count. To calculate acreage multiply the count by the square meters conversion factor which is dependent upon the CDL pixel size. The conversion factor for 30 meter pixels is 0.222394. The conversion factor for 56 meter pixels is 0.774922. - How can I create a legend for the CDL using ESRI ArcGIS software?
Step-by-step instructions are provided on how to create a CDL legend using ArcGIS at: CDL_Create_Legend.pdf.
- Is any smoothing or filtering applied to the CDL?
In general, no smoothing or filtering is done to the CDL classification. However, there have been exceptions in the past. The original 2006 CDL products did contain a small level of smoothing, but in March of 2009 all but one of the 2006 CDL products with were re-released with no smoothing. The one exception is the 2006 Washington CDL which still contains the smoothing. Smoothing has also been applied to cranberries in the 2008, 2009, 2010 and 2011 New England States and to oranges in 2008, 2009 and 2010 Florida.
- How do I add category names to a downloaded .tif image in ESRI ArcGIS?
If your downloaded CDL .tif file does not contain category names, then you can add them using the following instructions. Download this file: generic_cdl_attributes.tif.vat.dbf. This generic file contains all possible CDL colors and category names. As long as the .tif file and the .tif.vat.dbf file have the same file name, then the category names will load automatically in ArcMap. So, change the file name (not extension) of the generic_cdl_attributes.tif.vat.dbf to match the file name of the downloaded CDL .tif file. Then add the .tif file as a layer in ArcMap. The category names will display in the Table of Contents window.
Example 1 - If the downloaded .tif file name is: _NASS_DATA_CACHE_CDL_2011_clip_20110307142903_862761787.tif then change the generic_cdl_attributes.tif.vat.dbf file name to: _NASS_DATA_CACHE_CDL_2011_clip_20110307142903_862761787.tif.vat.dbf
Example 2 - If you renamed the downloaded .tif file to MyCDL.tif, then rename the generic_cdl_attributes.tif.vat.dbf file name to MyCDL.tif.vat.dbf. - I am using Erdas Imagine to view downloaded CDL data, but there is no histogram information. How do I build statistics in Erdas Imagine?
To generate statistics in Erdas Imagine, go to Tools > Image Information then click on "Compute the statistics." If you have the TIF file open in a Viewer, then you will have to close it and reopen the TIF file. Now when you view the attribute information, there should be a Histogram column, which represents the pixel count per category. To calculate acreage multiply the count by the square meters conversion factor which is dependent upon the CDL pixel size. The conversion factor for 30 meter pixels is 0.222394. The conversion factor for 56 meter pixels is 0.774922.
- How do I add category names and/or colors to my downloaded CDL data in Erdas Imagine?
You first must build statistics for the TIF file as outlined in the question above. To add category names, open the TIF in a Viewer and select Raster > Attributes. In the Raster Attribute Editor select Edit > Add Class Names. This new "Class Names" column can be populated manually or you can download this prepared file at: cdl_class_names.zip. Save to your computer, unzip, and then in the Raster Attribute Editor highlight the "Class Names" column by left-clicking on the header of the Class Names column. Next, right-click on the Class Names column and select the Import option. Specify the CDL_Names file as the file to import and this will add all possible CDL class names to your TIF attribute table. You can add colors by importing the CDL_Colors file similar to the steps used to add the class names.
- What other geospatial products does NASS offer, such as the Cultivated Layer, Crop Frequency Data Layers, Confidence Layer, and Crop Sequence Boundaries?
The CroplandCROS web service hosts the Cropland Data Layer (CDL) and many of the CDL derivatives listed below and allows users to easily conduct area and statistical analysis of planted U.S. commodities, geolocate farms, and map areas of interest. User guides and instructional videos are available at the CroplandCROS website.
The Crop Sequence Boundaries was developed with USDA's Economic Research Service, produces estimates of field boundaries, crop acreage, and crop rotations across the contiguous United States. It uses satellite imagery with other public data and is open source allowing users to conduct area and statistical analysis of planted U.S. commodities and provides insight on farmer cropping decisions. NASS needed a representative field to predict crop planting based on common crop rotations such as corn-soy and ERS is using this product to study changes in farm management practices like tillage or cover cropping over time. CSB represents non-confidential single crop field boundaries over a set time frame. It does not contain personal identifying information. The boundaries captured are of crops grown only, not ownership boundaries or tax parcels (unit of property). The data are from satellite imagery and publicly available data, it does not come from producers or agencies like the Farm Service Agency.
The Crop Progress and Condition Gridded Layers are fully synthetic representations of confidential, county level data. These data are available for U.S. corn, soybeans, cotton and winter wheat. The current archive of these datasets span growing-season weeks for all years from 2015 to present. State level representations of this data in chart form are available at Crop Progress and Condition Charts.
The Cultivated Layer is based on the most recent five years of CDL data and is updated annually. An Erdas Imagine Spatial Model is used to create the Cultivated Layer. The processing logic is as follows. If a pixel is identified as cultivated in at least two out of the five years of CDL data then it is assigned to the 'Cultivated' category. The exception is that all pixels identified as cultivated in the most recent year are assigned to the 'Cultivated' category regardless of whether or not they were cultivated in the previous four years of CDL data.
The Crop Frequency Data Layers identify crop specific planting frequency and are based on land cover information derived from every year of available CDL data beginning with 2008, the first year of full Continental U.S. coverage. There are currently four individual crop frequency data layers that represent corn, cotton, soybeans, and wheat. Please be aware that there is overlap between these layers where double-cropping between these crop types exists.
The Confidence Layer is a derivative of the CDL. The following description of the confidence layer is from the document titled 'MDA_NLCD_User_Guide.doc' which is available free for download with the NLCD Mapping Tool at http://www.mrlc.gov/. The Confidence Layer "spatially represents the predicted confidence that is associated with that output pixel, based upon the rule(s) that were used to classify it. This is useful in that the user can see the spatial representation of distribution and magnitude of error or confidence for a given classification... This error layer represents a percent confidence associated with each rule and output categorical, classified value. It is expressed as a percentage of confidence. A value of zero would therefore have a low confidence (always wrong), while a value of 100 would have a very high confidence (always right)." For more information on the use of confidence layers please refer to the following paper: Liu, Weiguo, Sucharita Gopal and Curtis E. Woodcock, 2004. Uncertainty and confidence in land cover classification using a hybrid classifier approach, Photogrammetric Engineering & Remote Sensing, 70(8):963-971. Ultimately, however, the confidence value is not a measure of accuracy for a given pixel but rather how well it fit within the decision tree ruleset.
The Disaster Analysis Program monitors agricultural disasters in near real-time and provide quantitative assessments using remotely sensed data and geospatial techniques.
The USDA-NASS area sampling frame delineates all parcels of land for the purpose of sampling. The area frame is constructed by visually interpreting satellite imagery to divide a state into stratification classes (strata) based on percent of land used in cultivation. Strata are typically defined by percent cultivated, non-agricultural land, urban use, agri-urban, or water. The Land Use Strata for Selected States area available for download.
Agricultural Statistics Districts (ASD) for the entire U.S. are available in ESRI shapefile format at: ASD shapefile. An ASD is defined as a contiguous group of counties having relatively similar agricultural characteristics. The ASD's used by NASS usually divide each state into as many as nine Agricultural Statistics Districts to make data comparison easier. Each district is more homogeneous with respect to agriculture than the state as a whole. The following link provides national State, ASD, and county codes in tabular .csv format asds2009.csv. Lists of state, ASD, and county can also be found at the following link: county_list.txt.
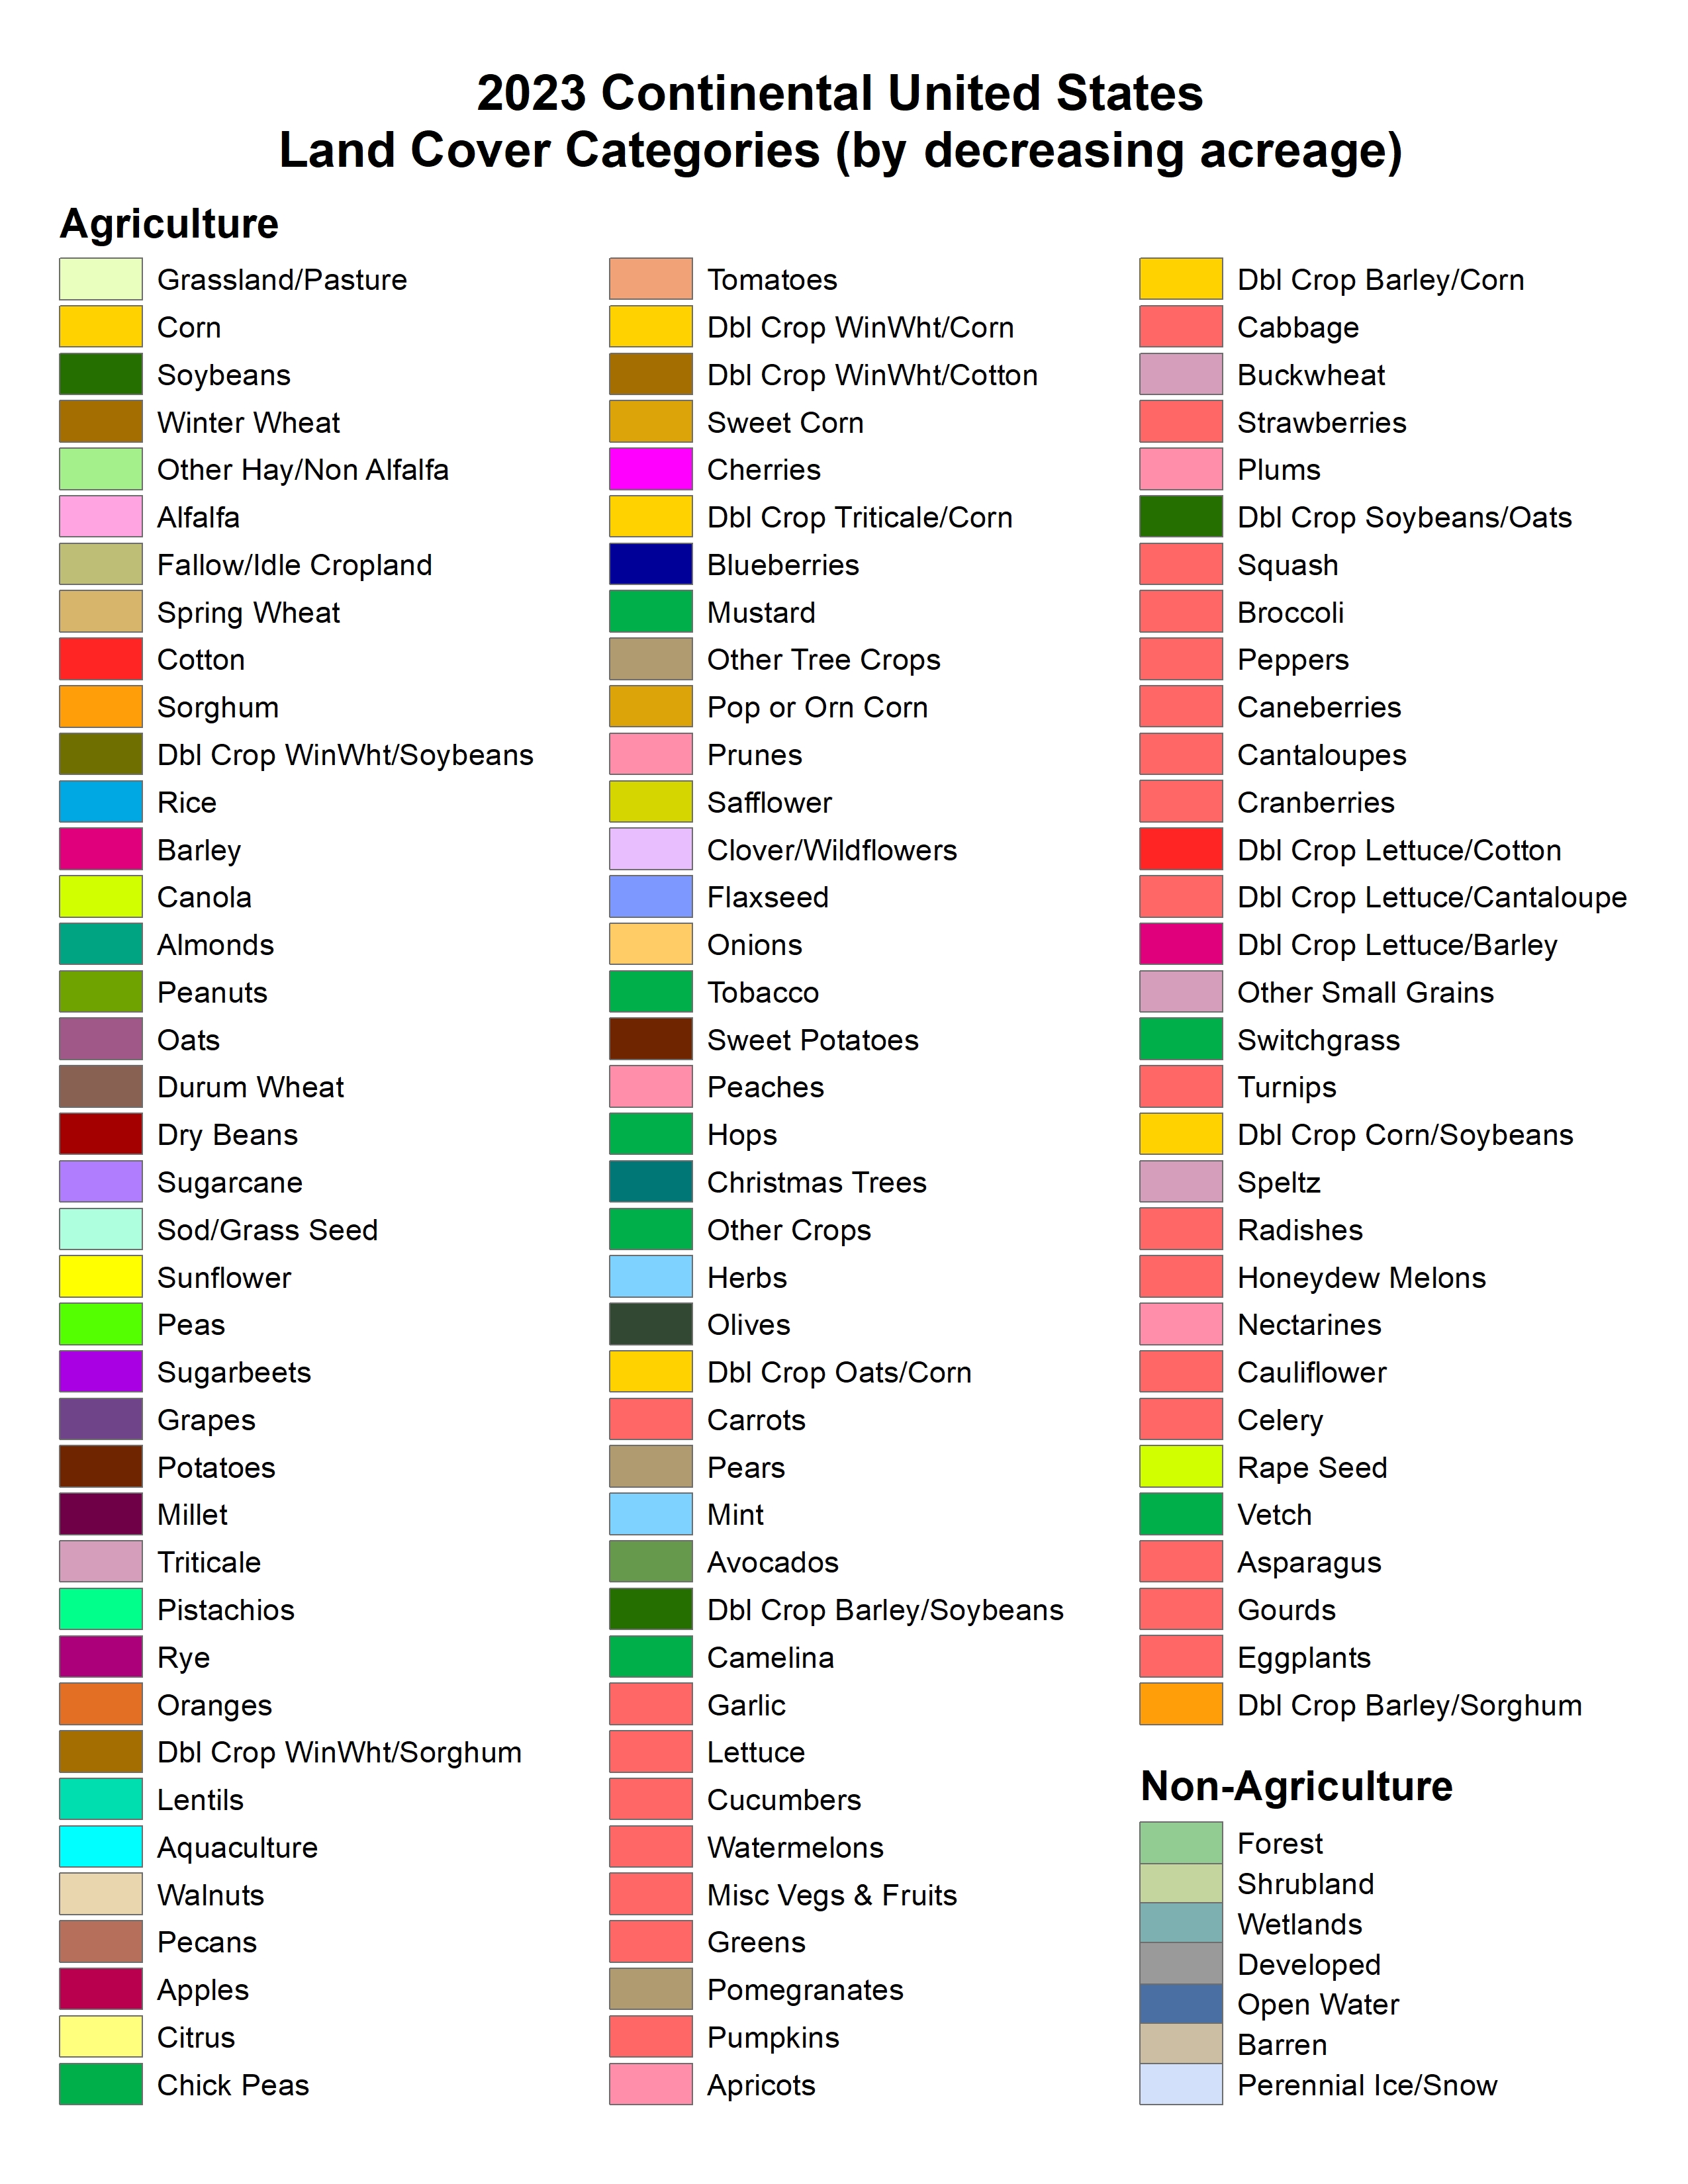
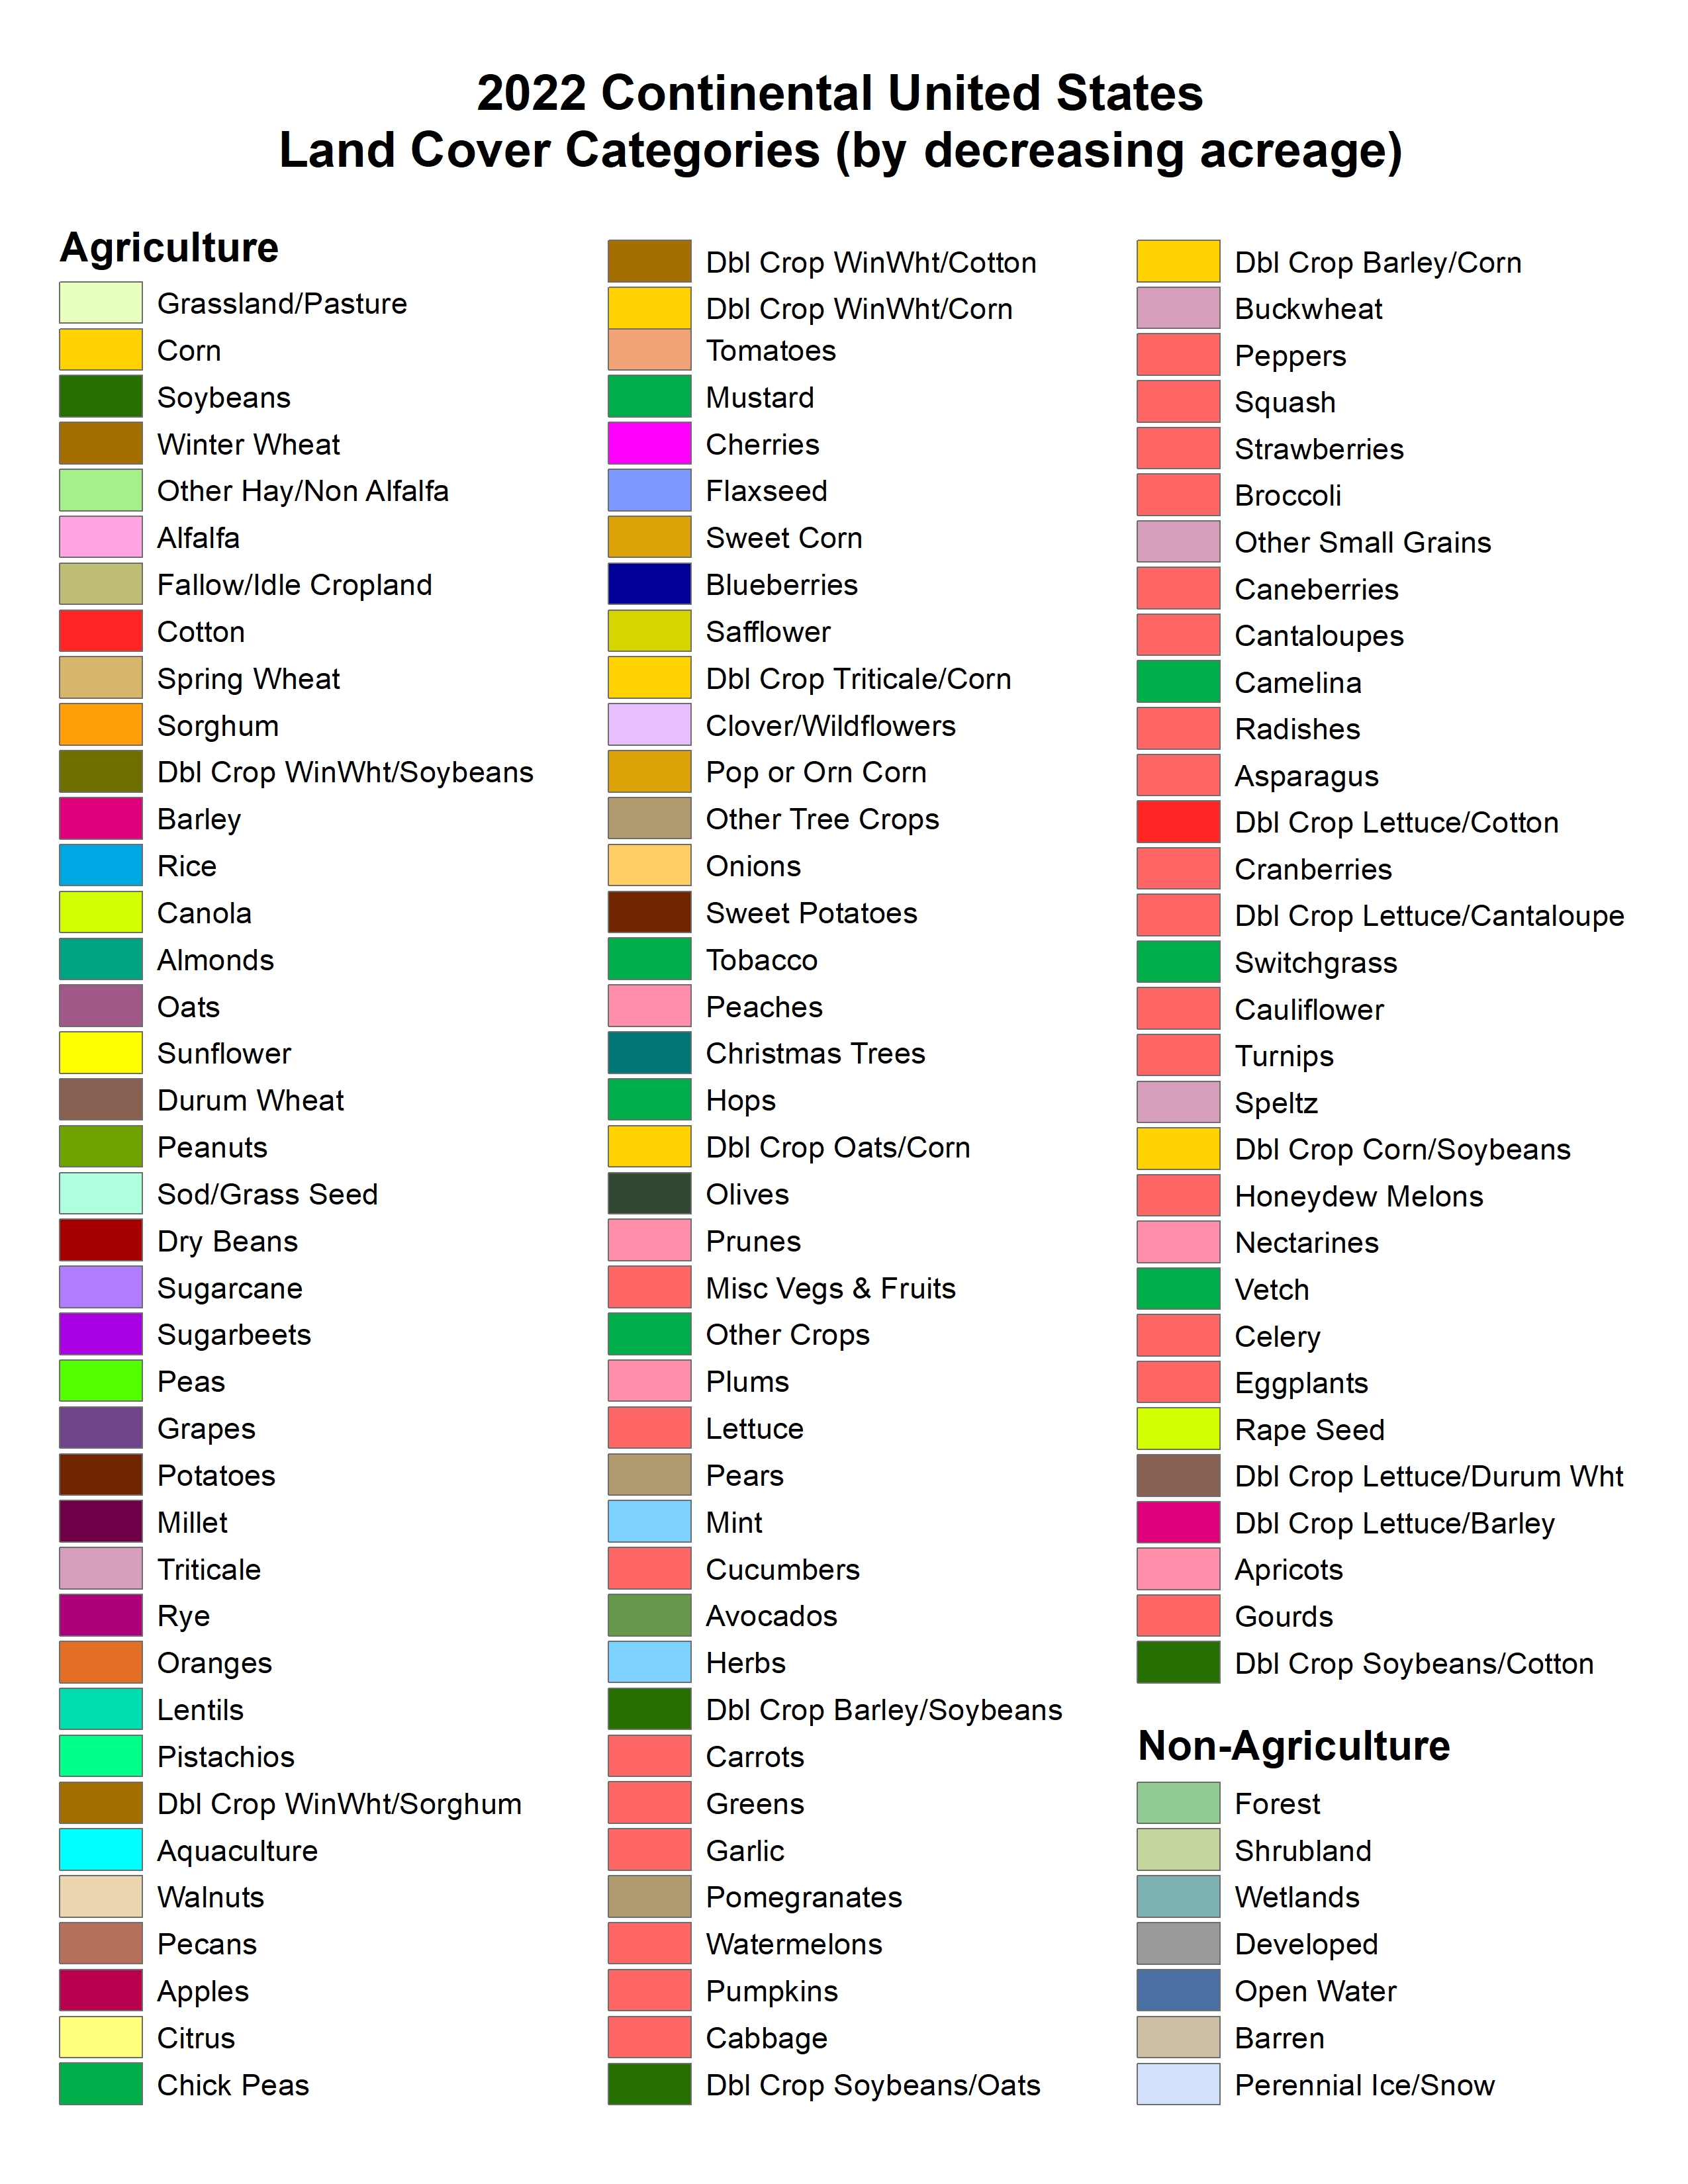
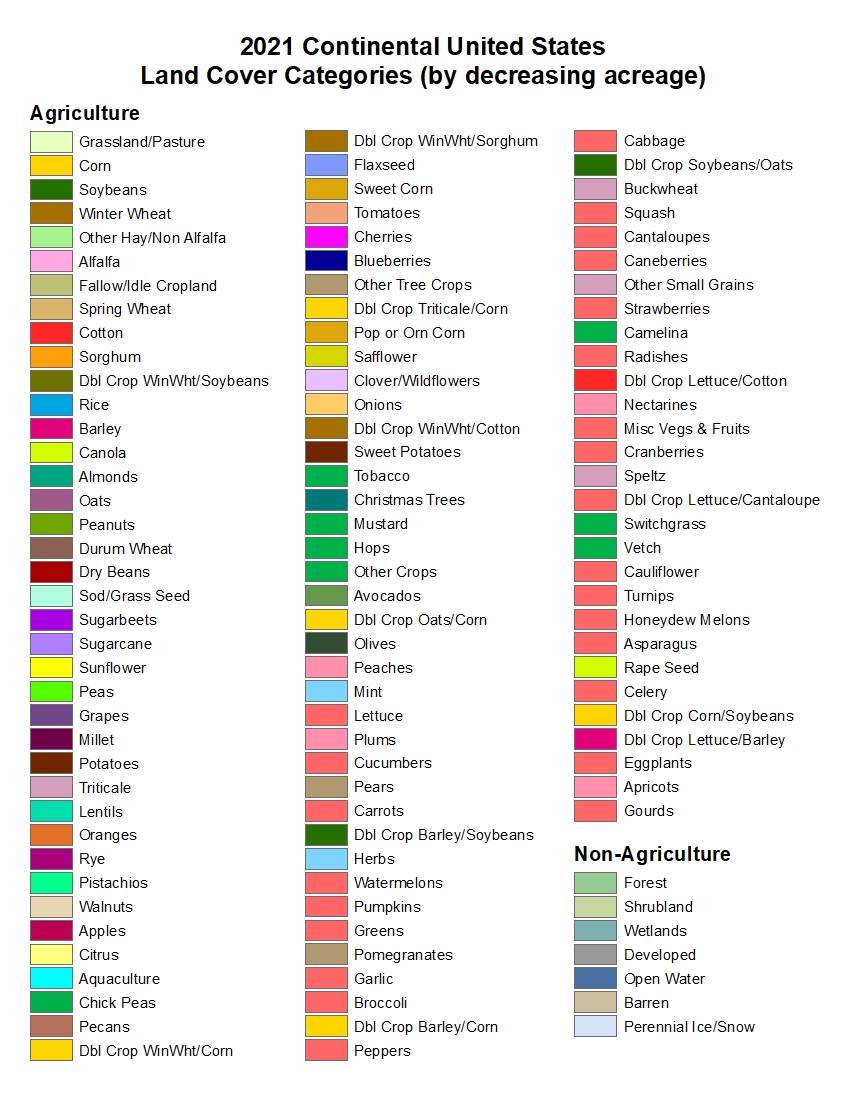
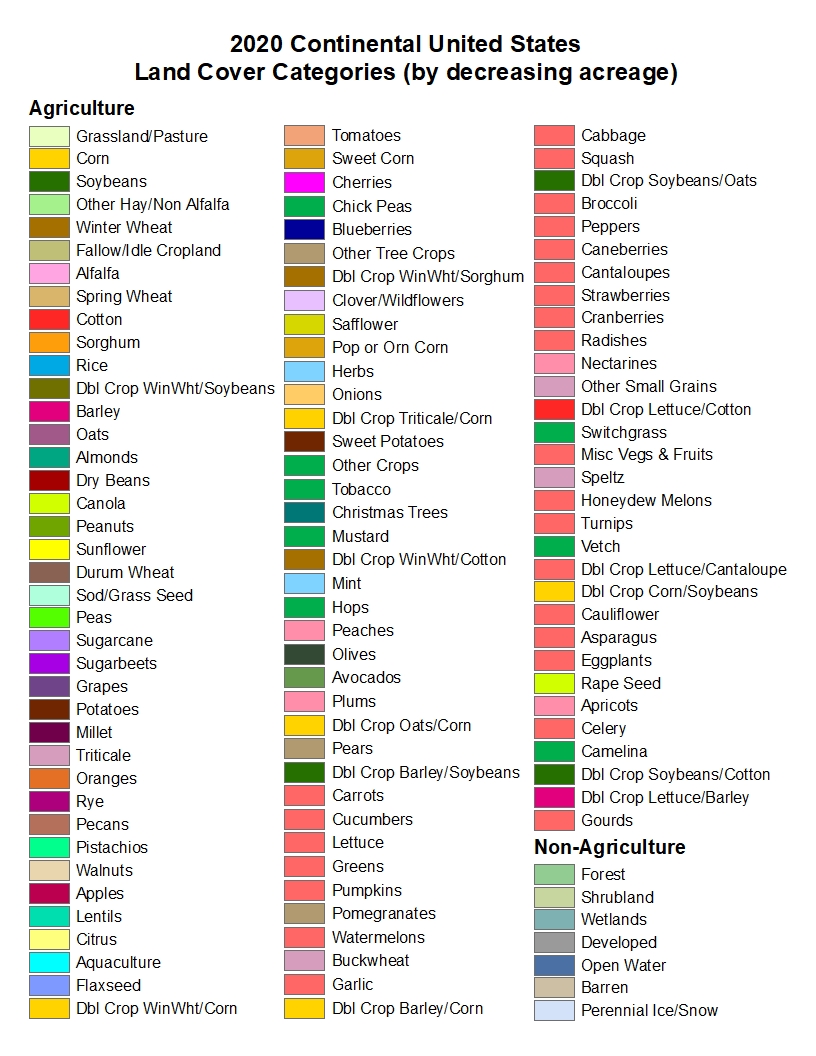
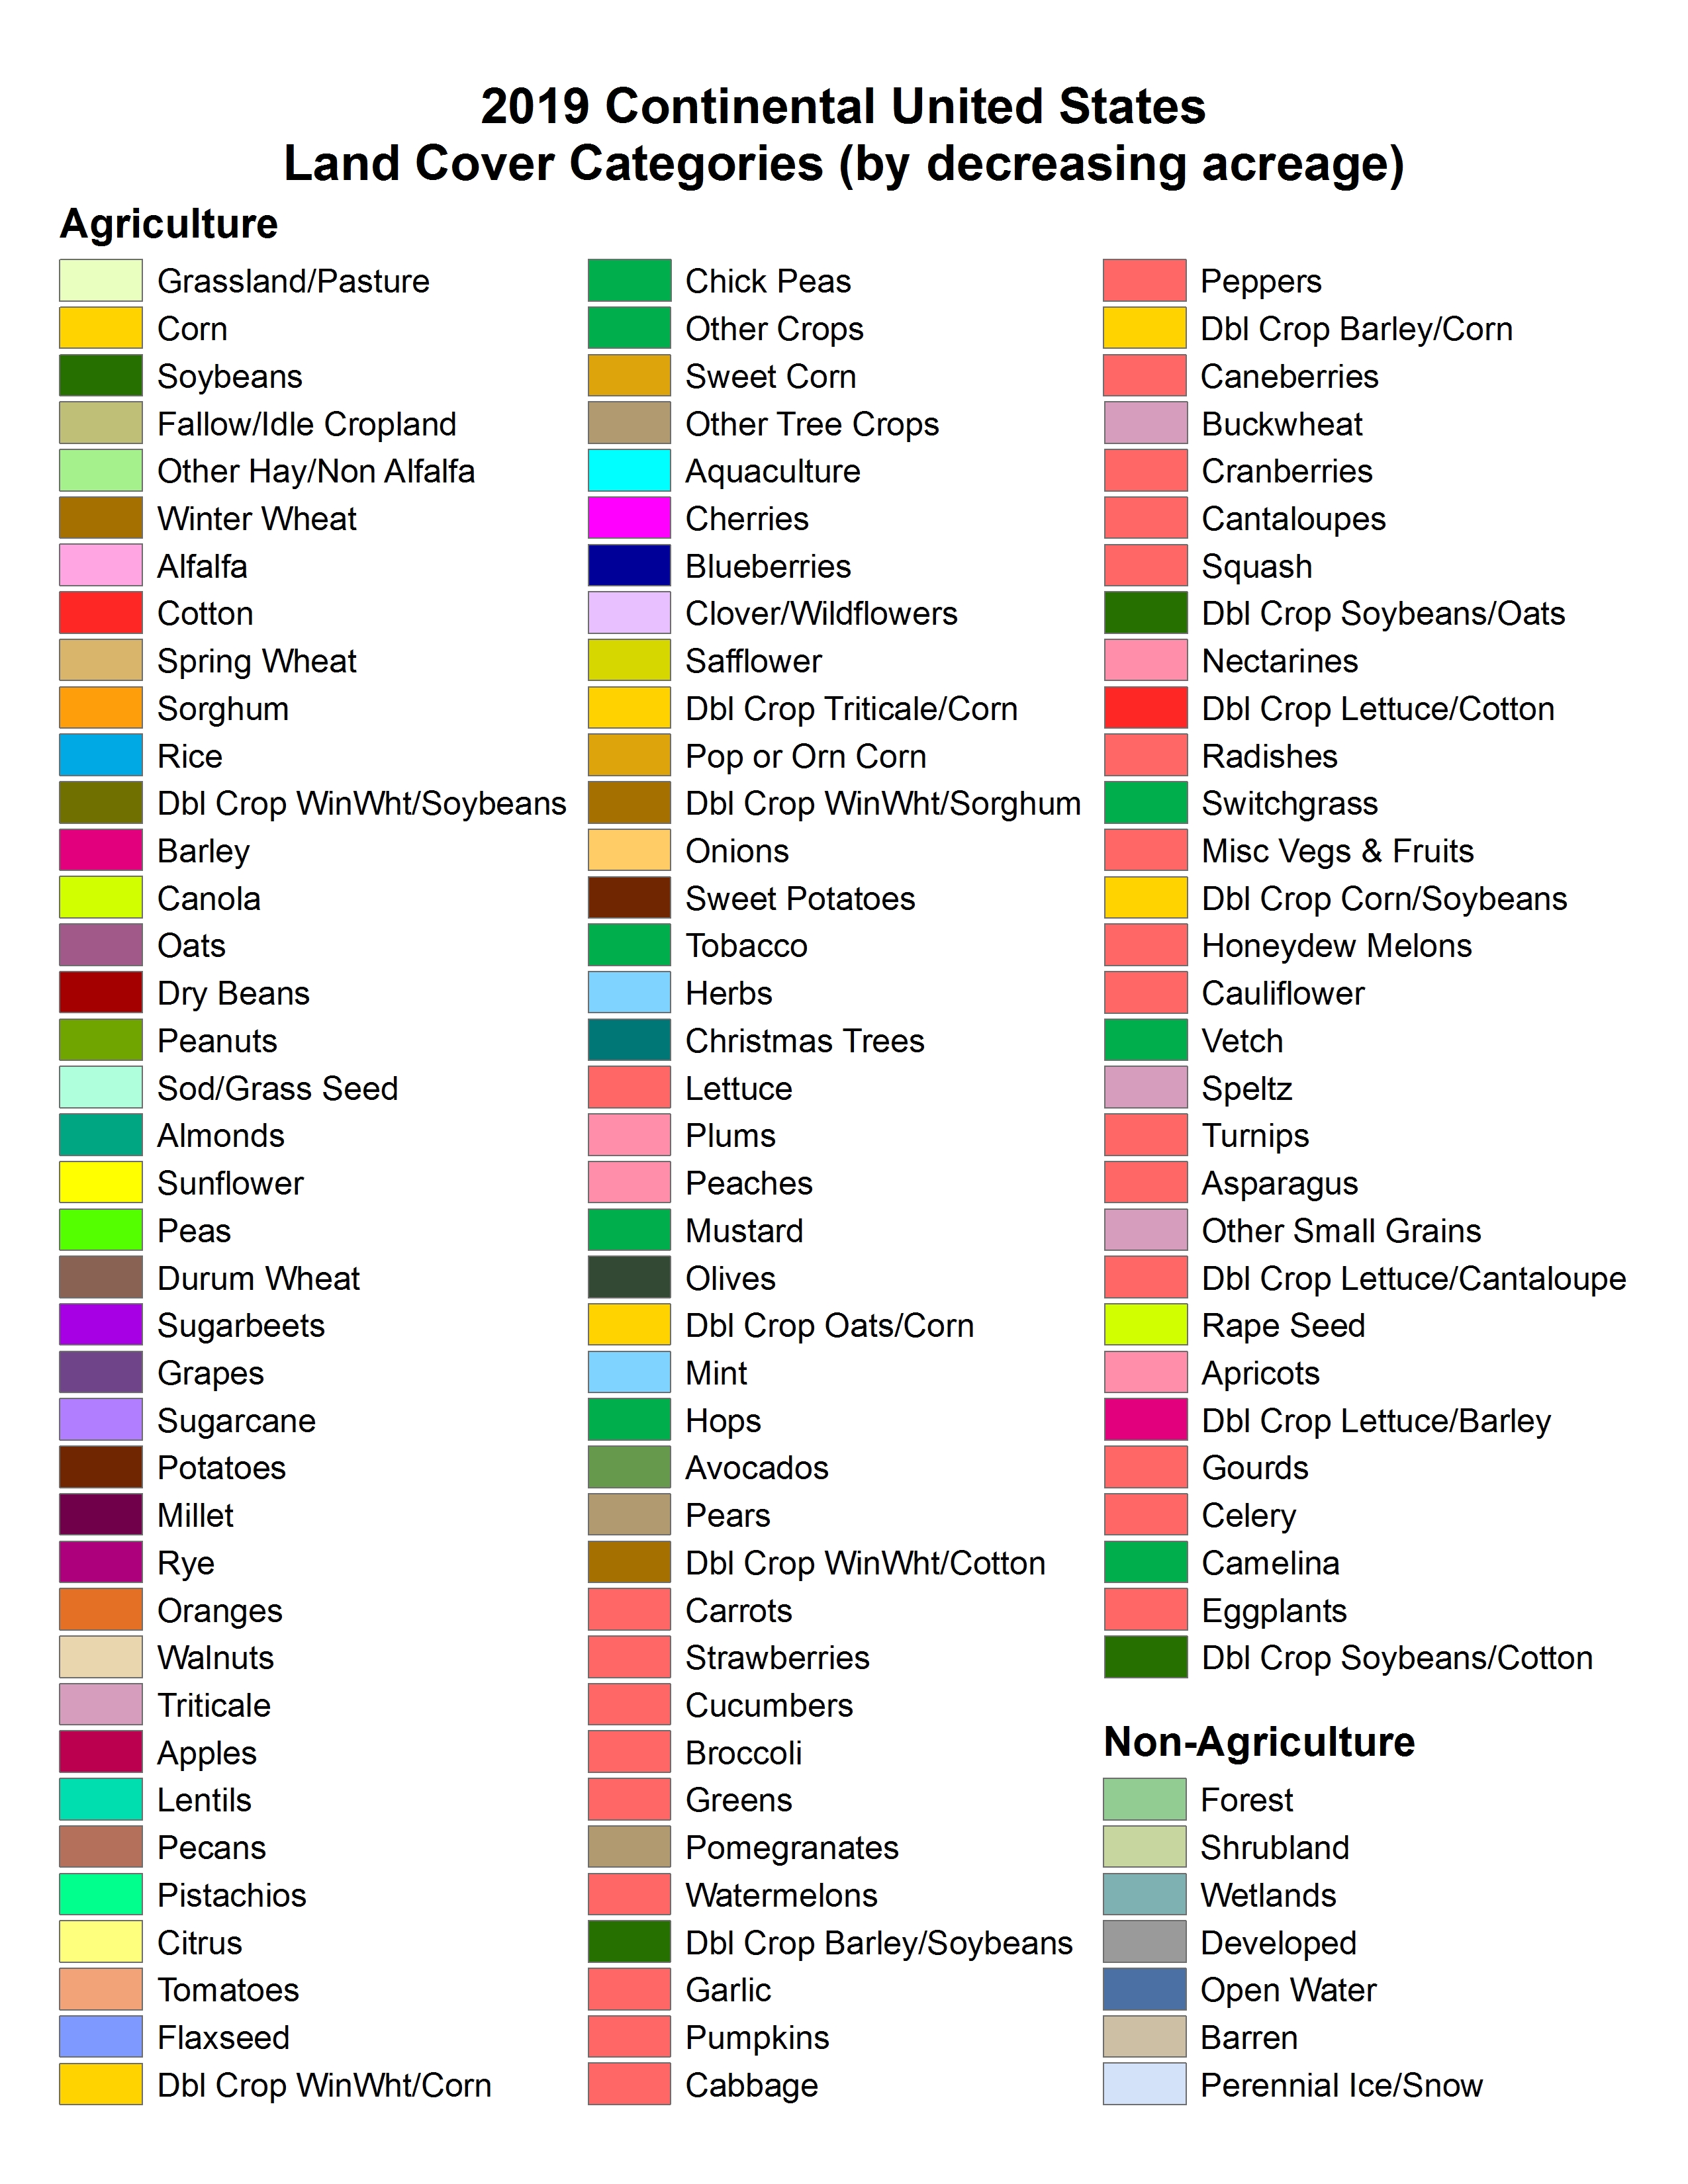
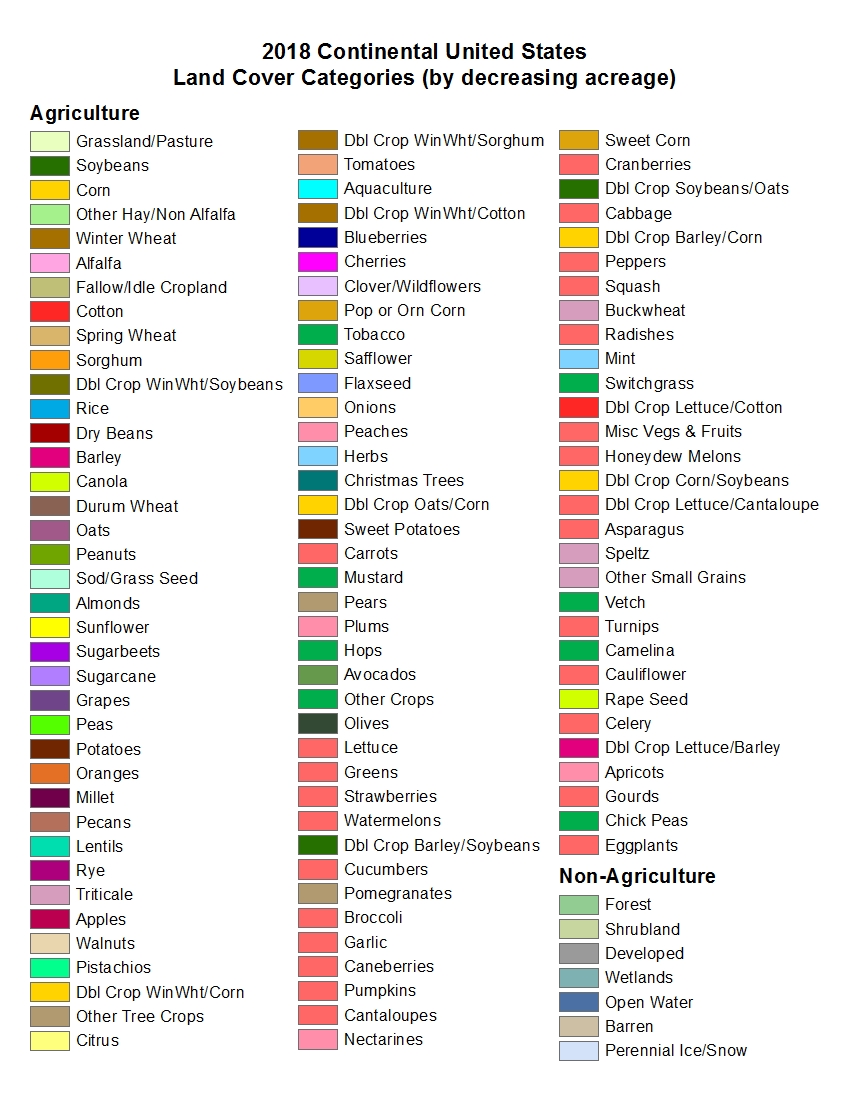
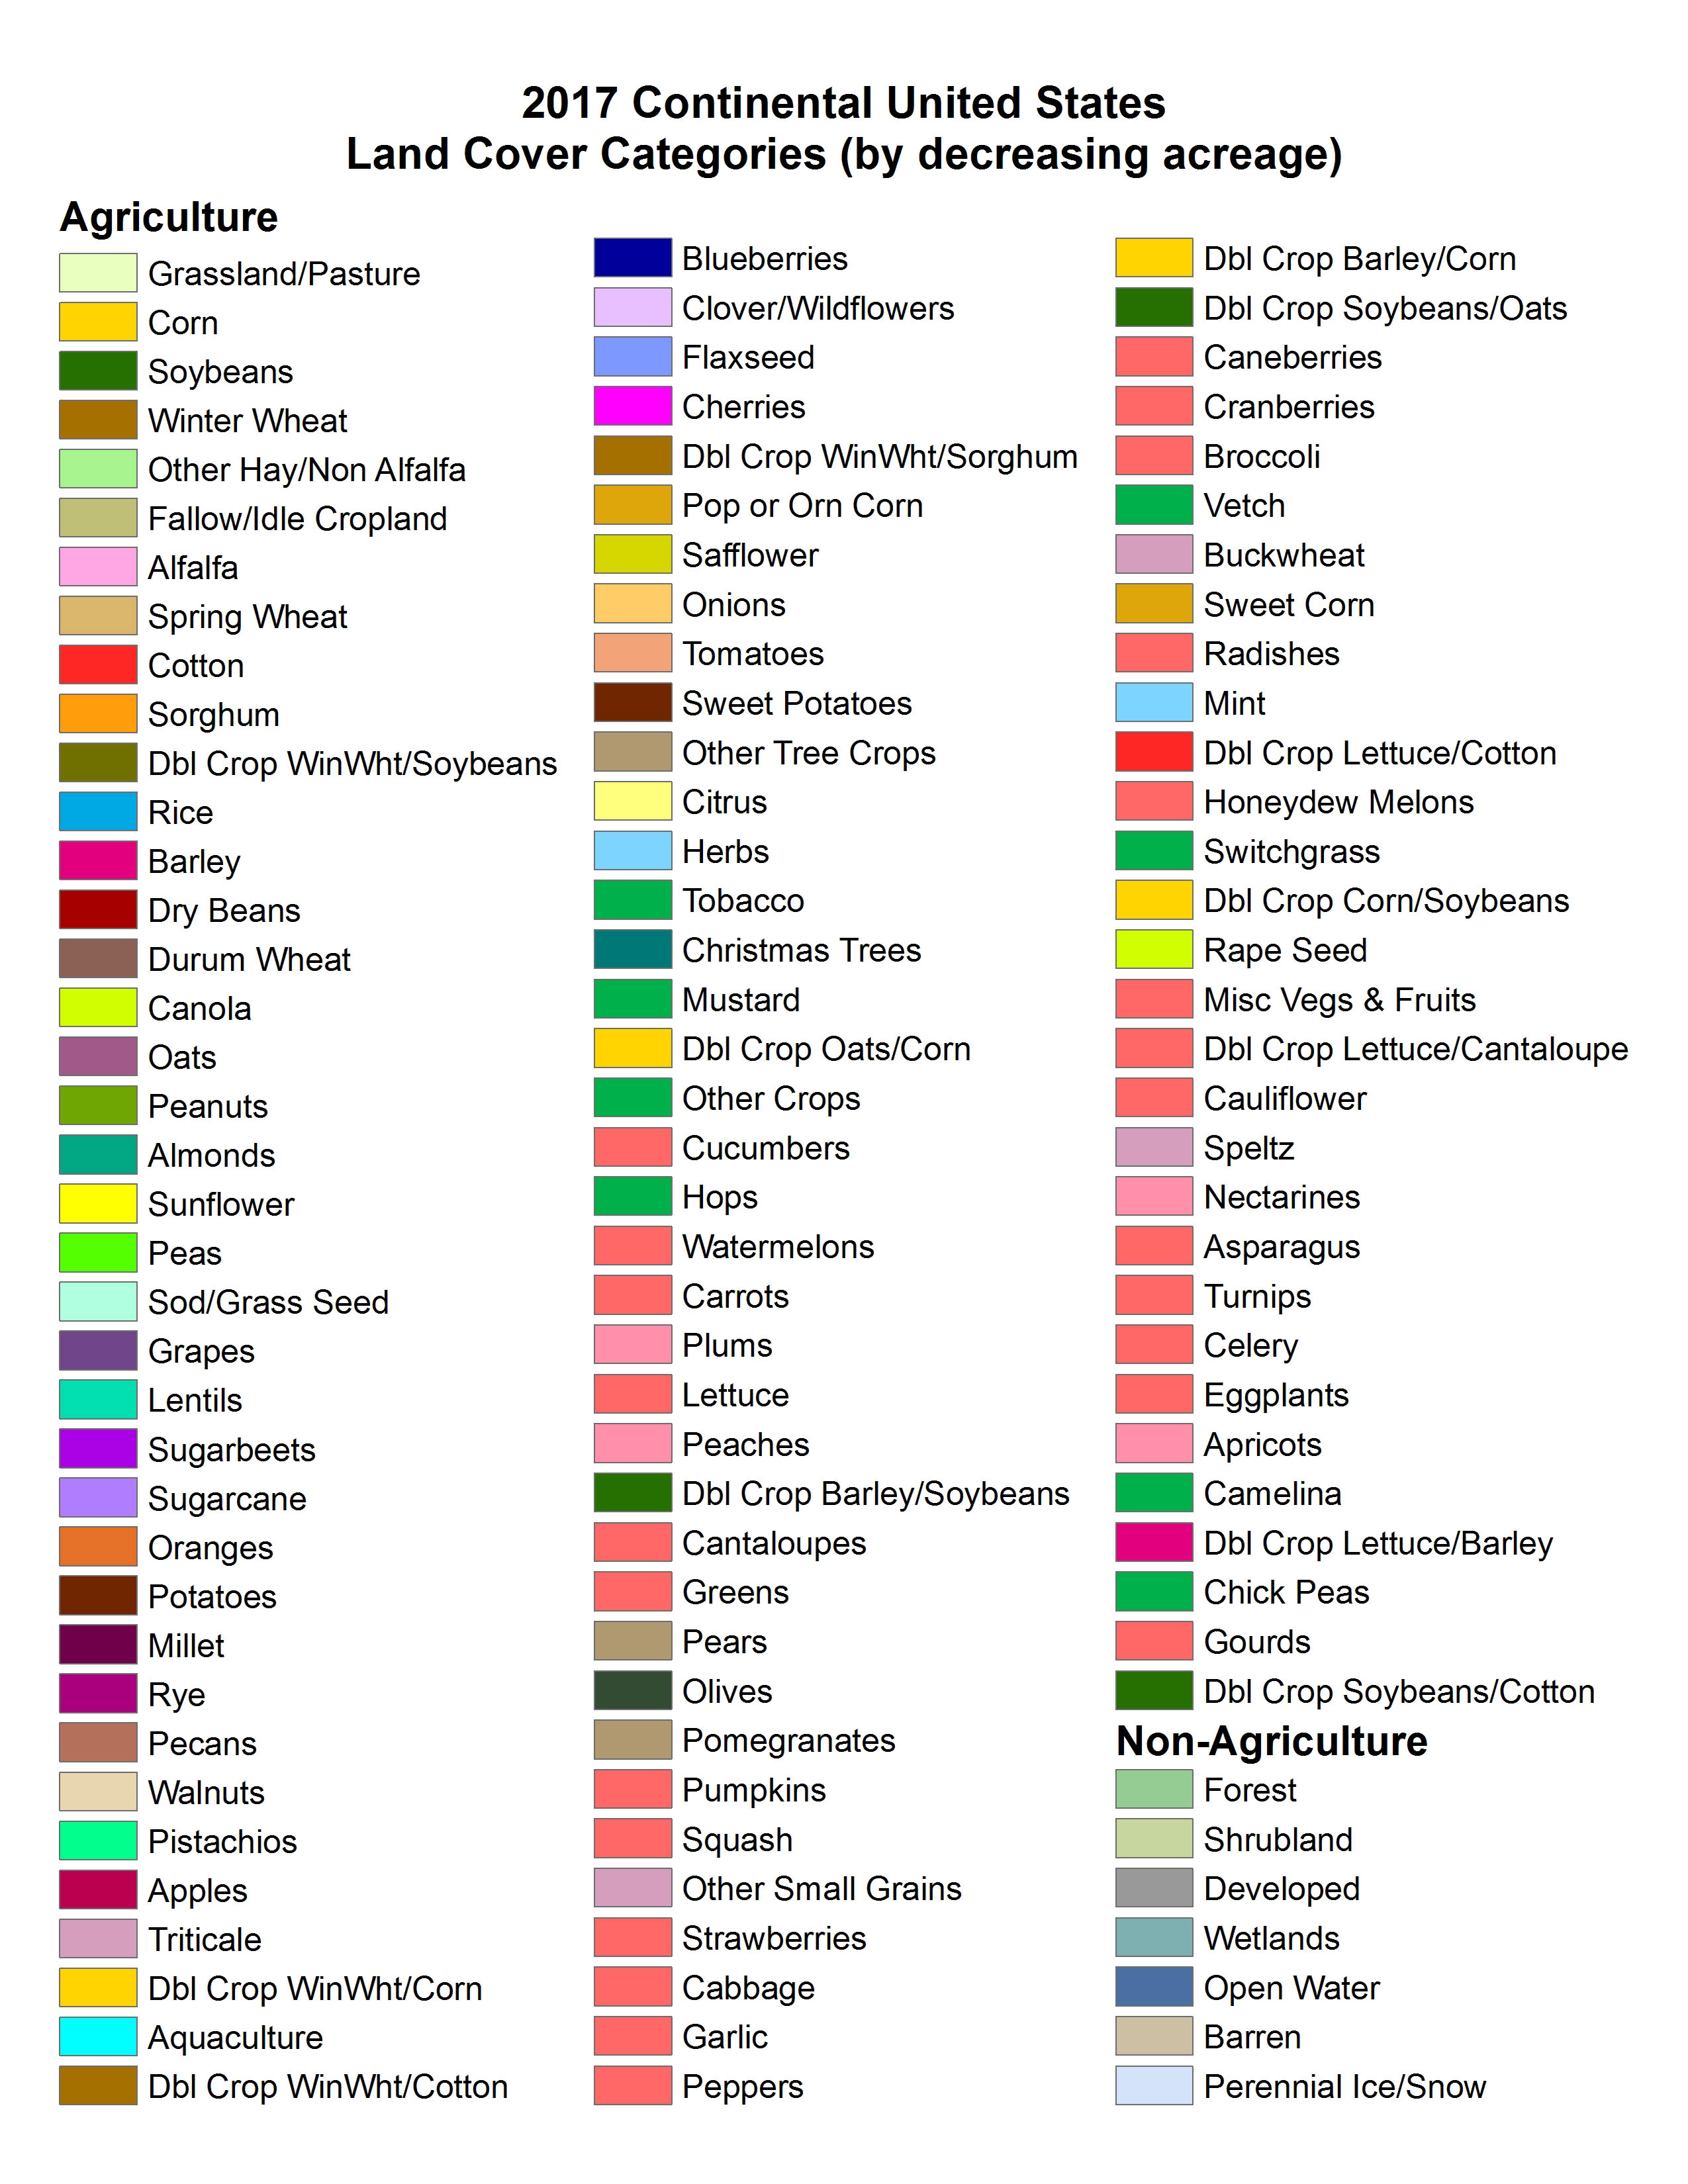
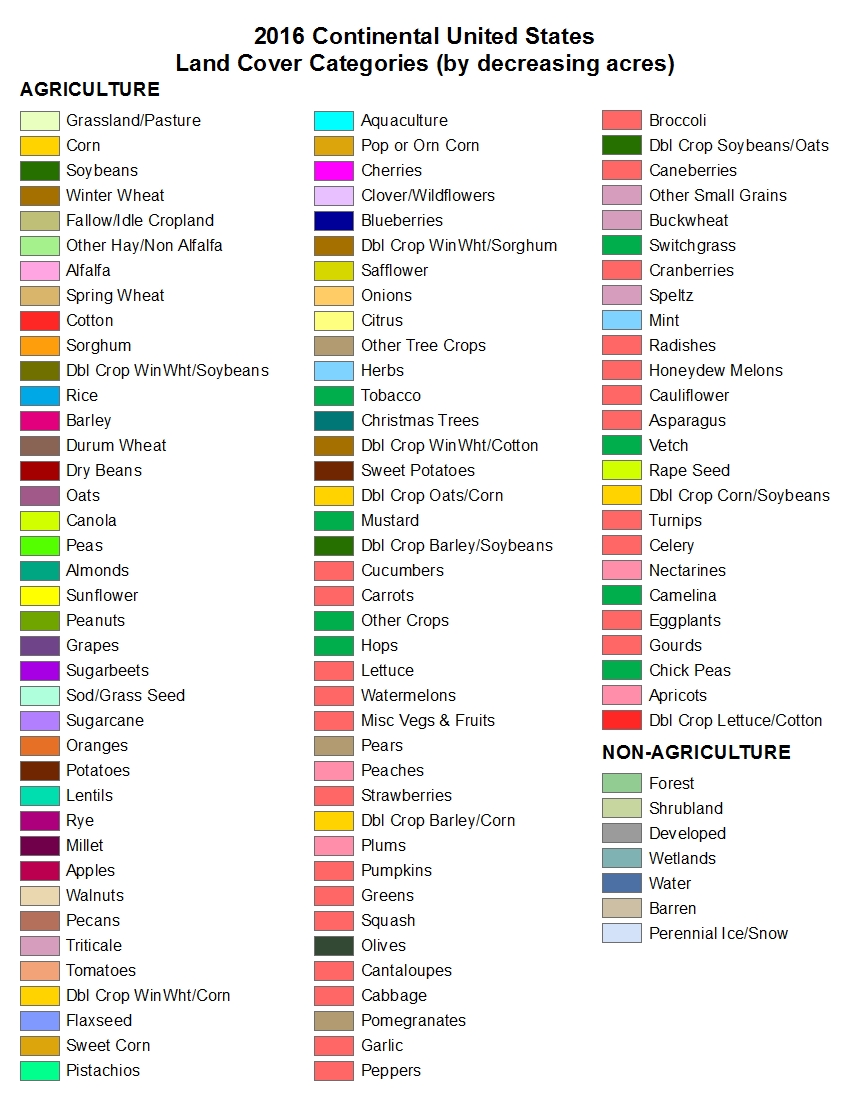
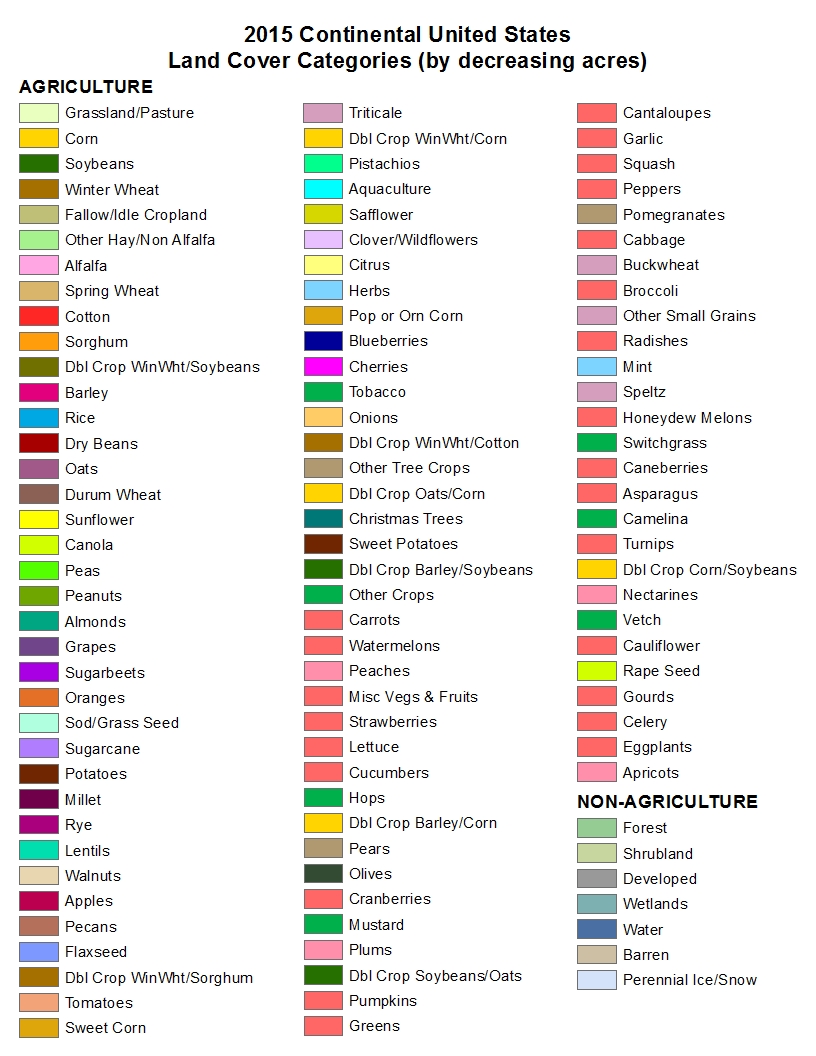
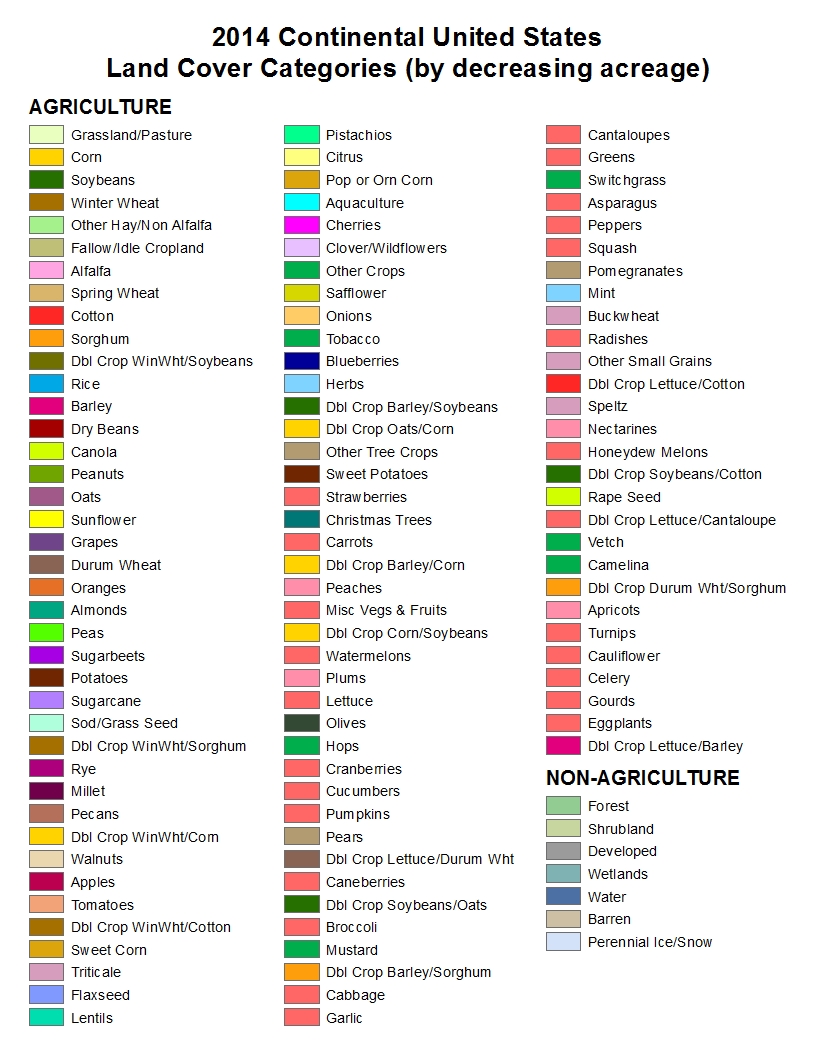
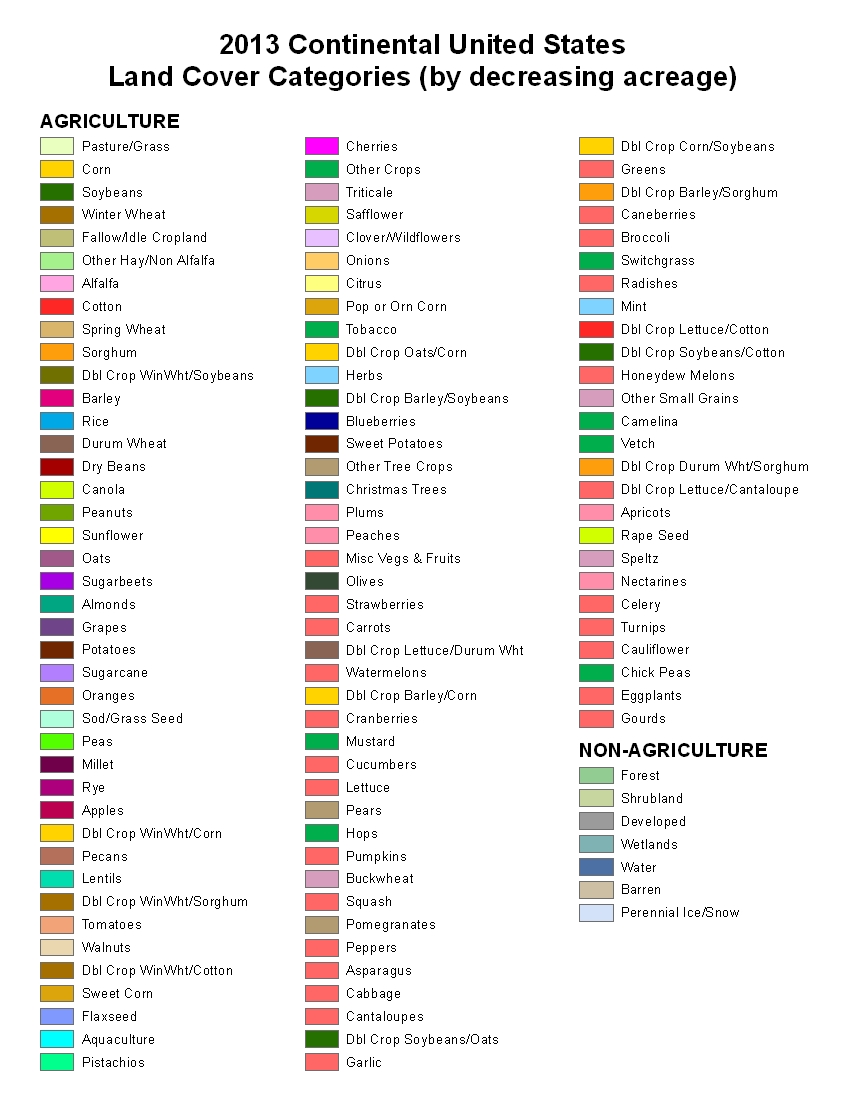
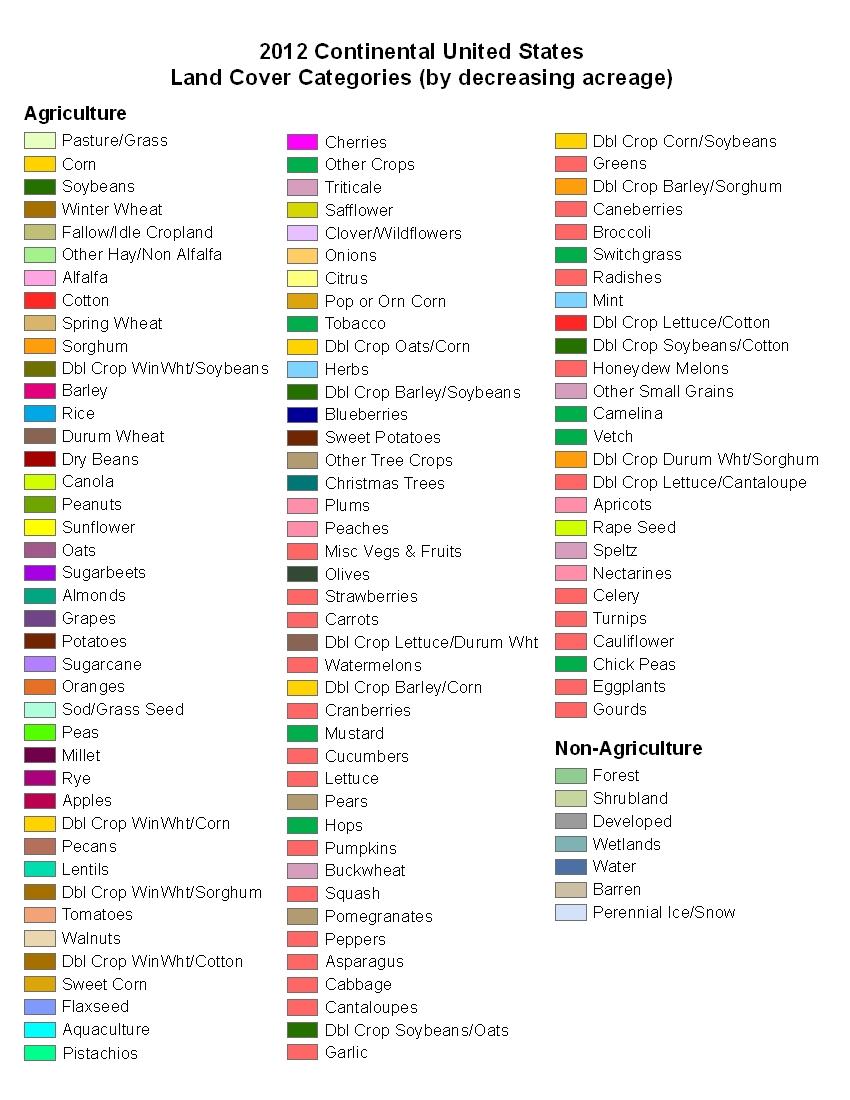
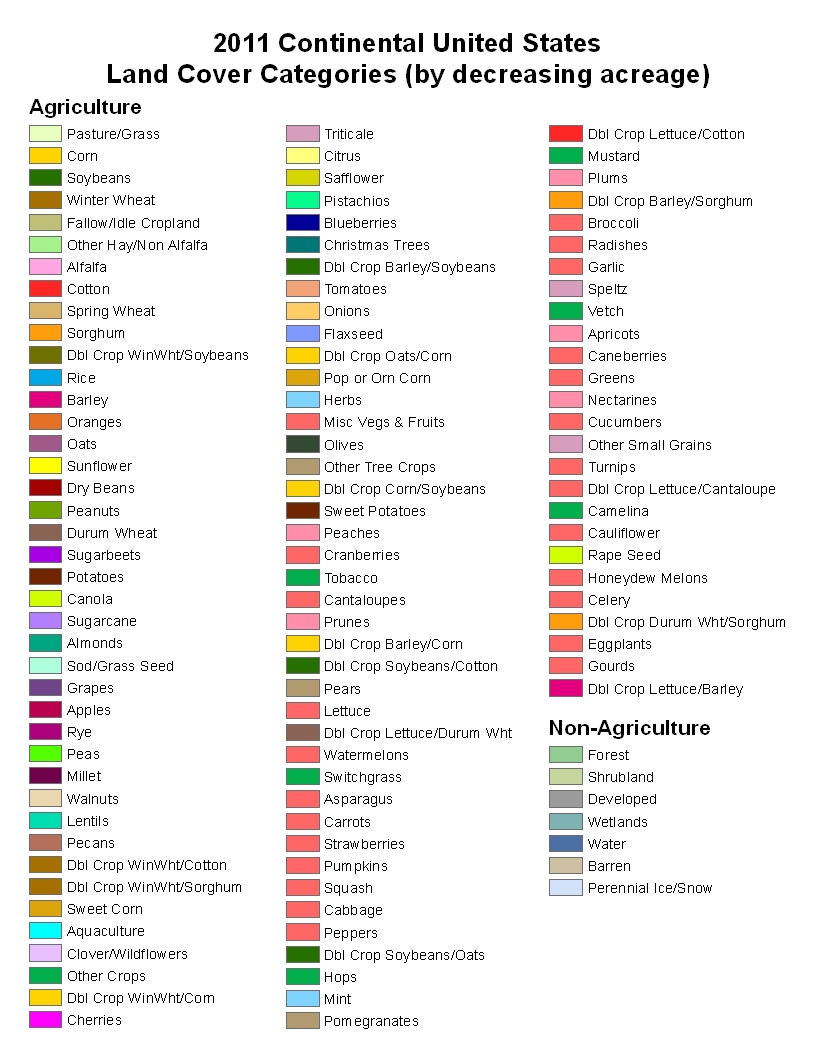
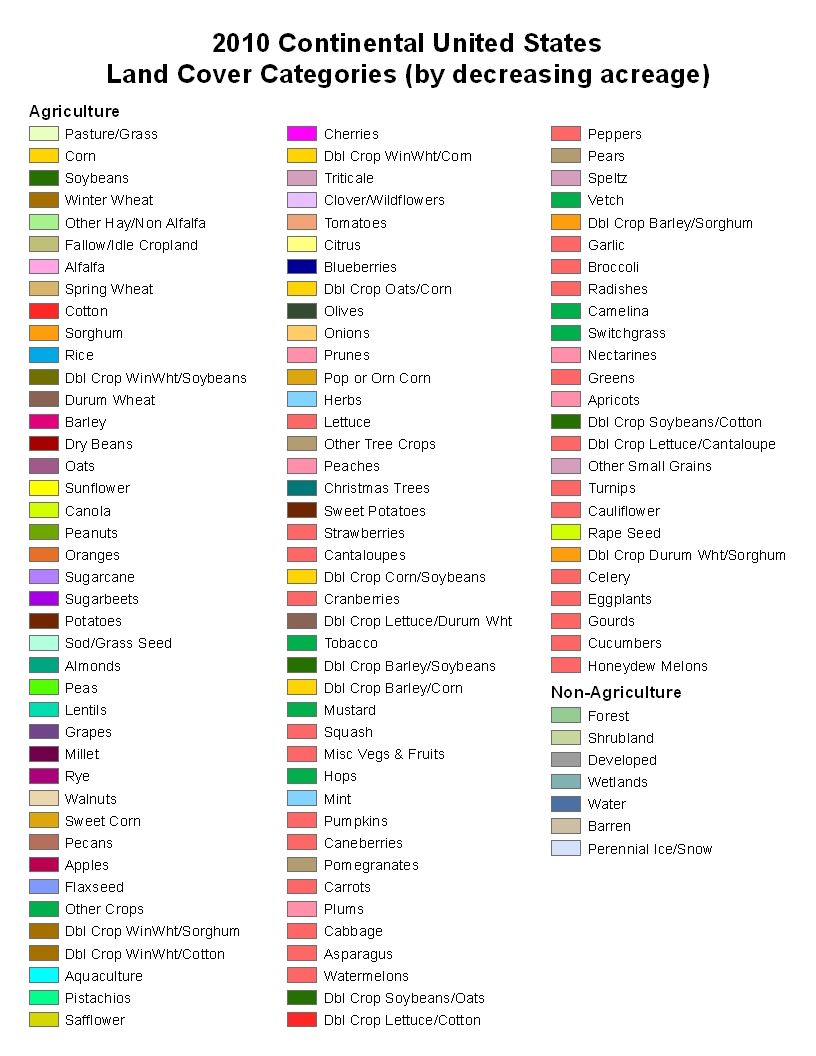
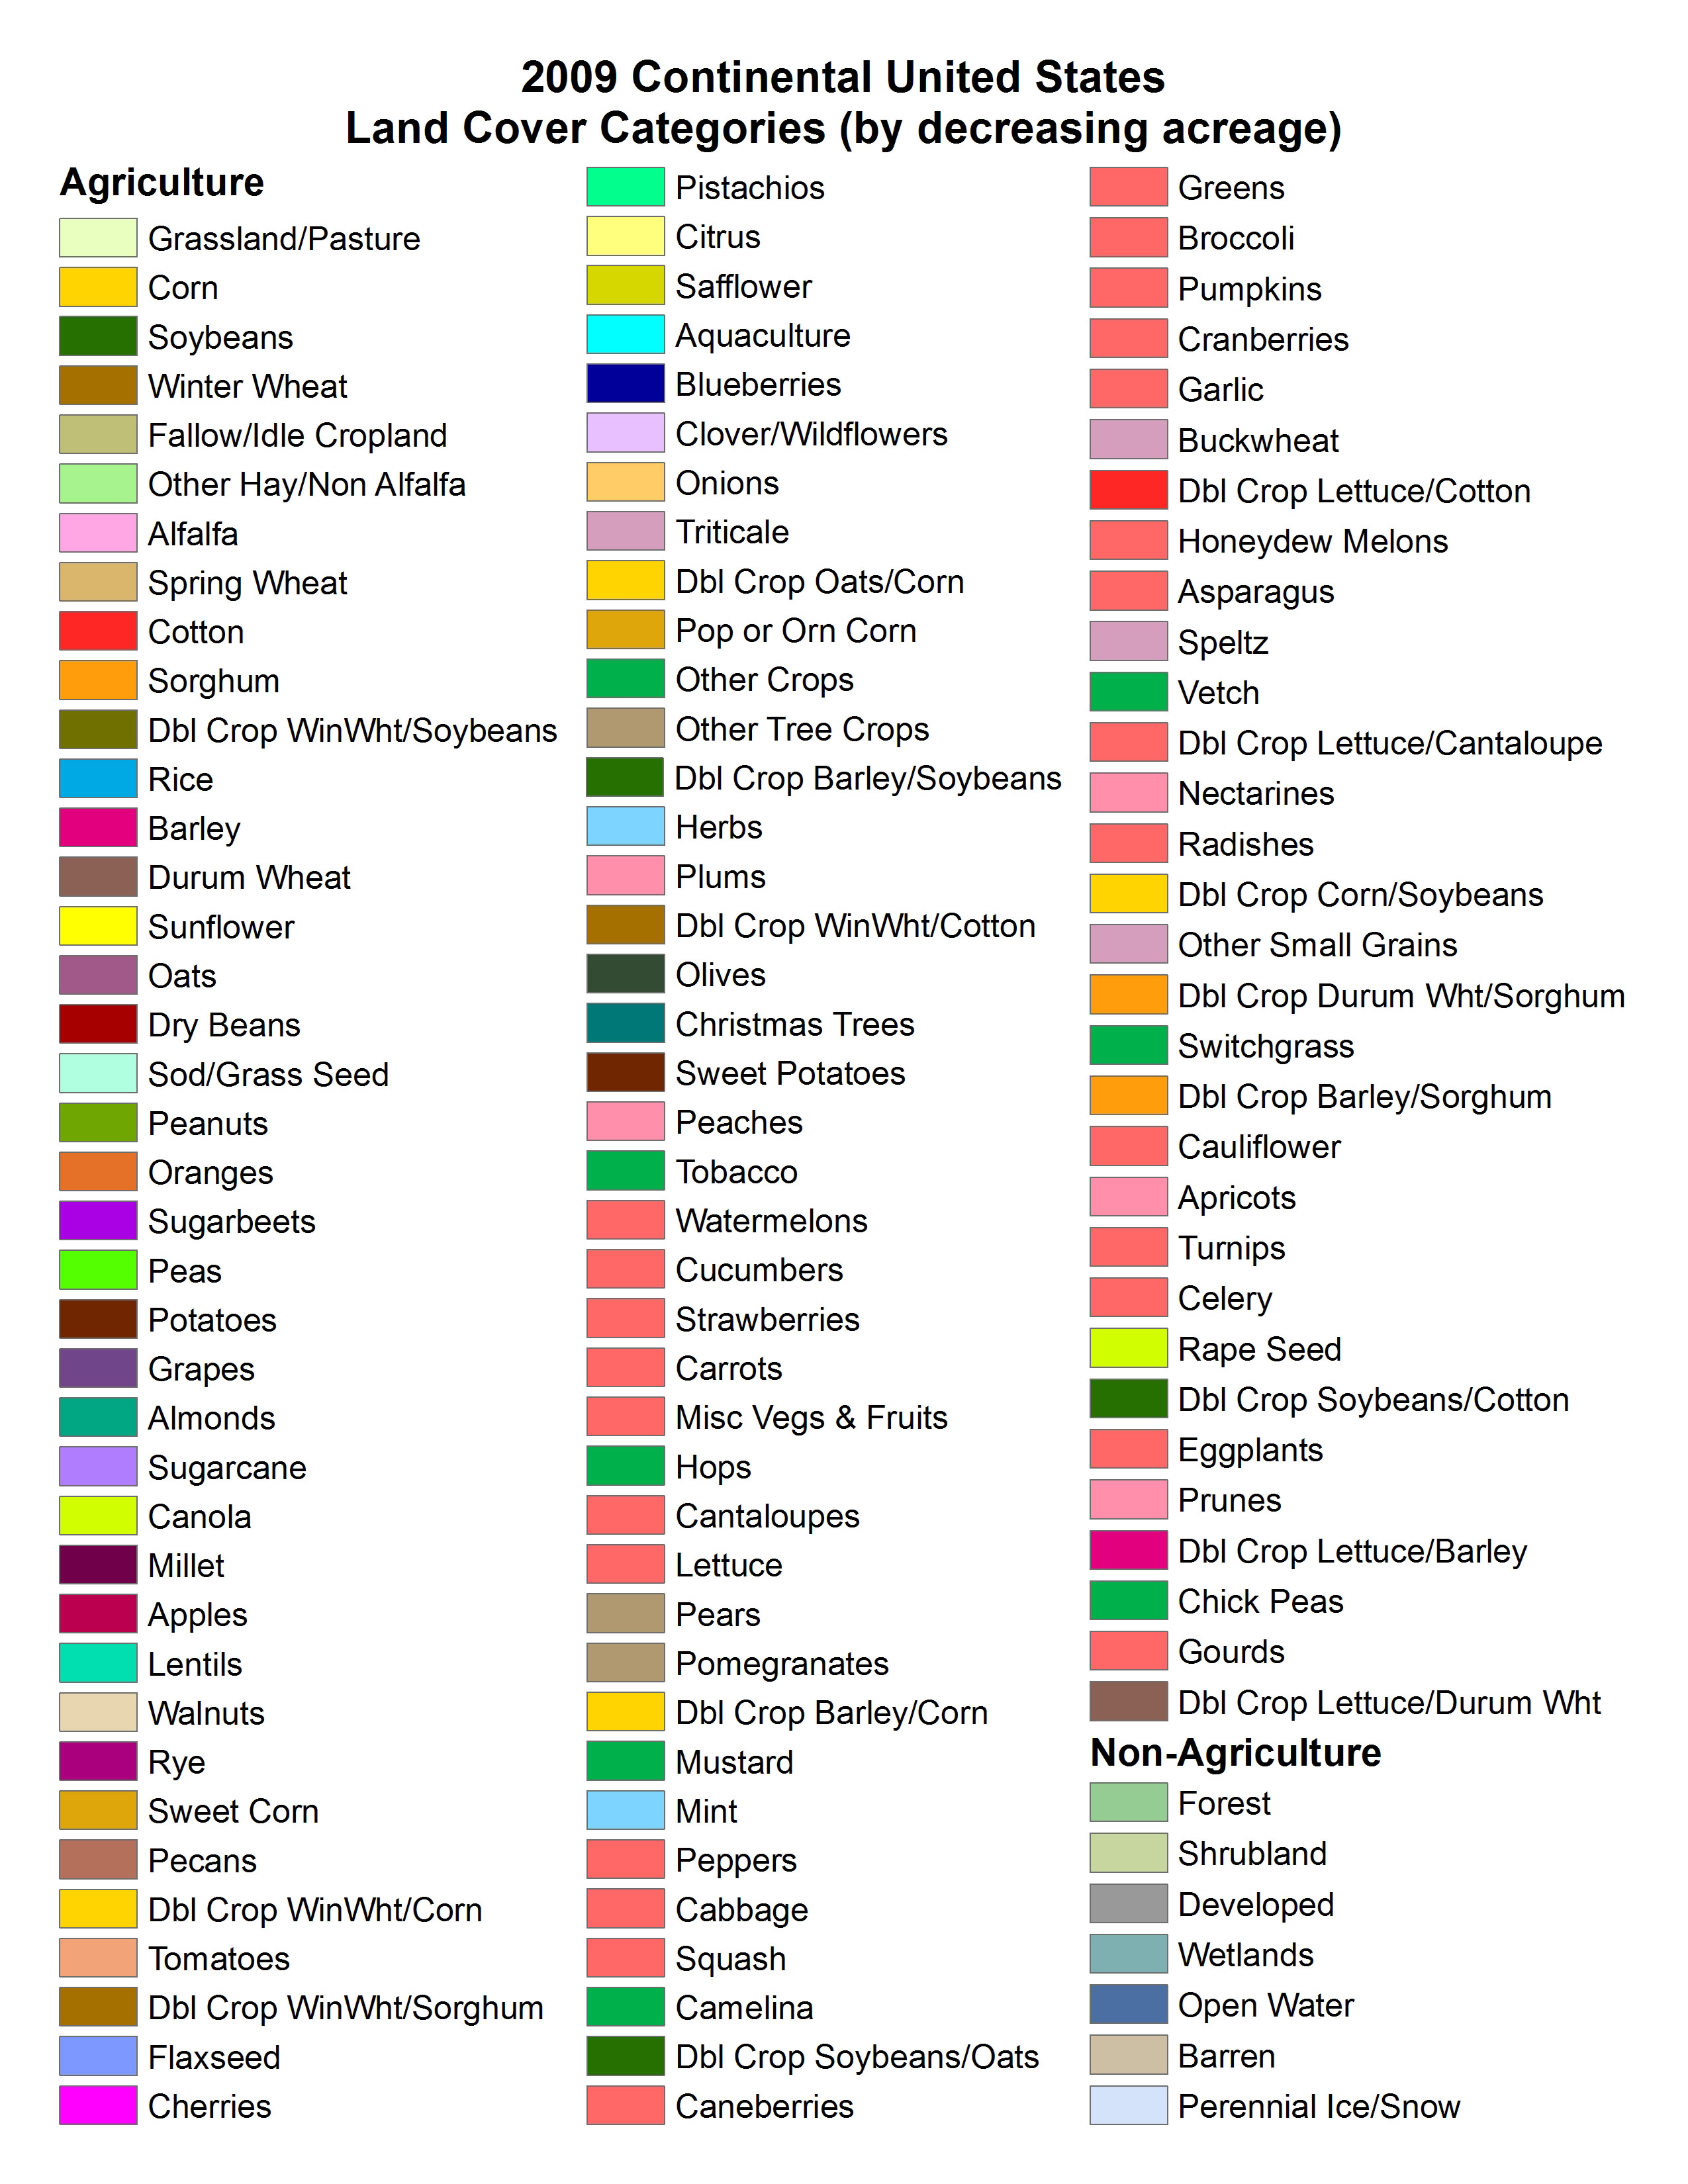
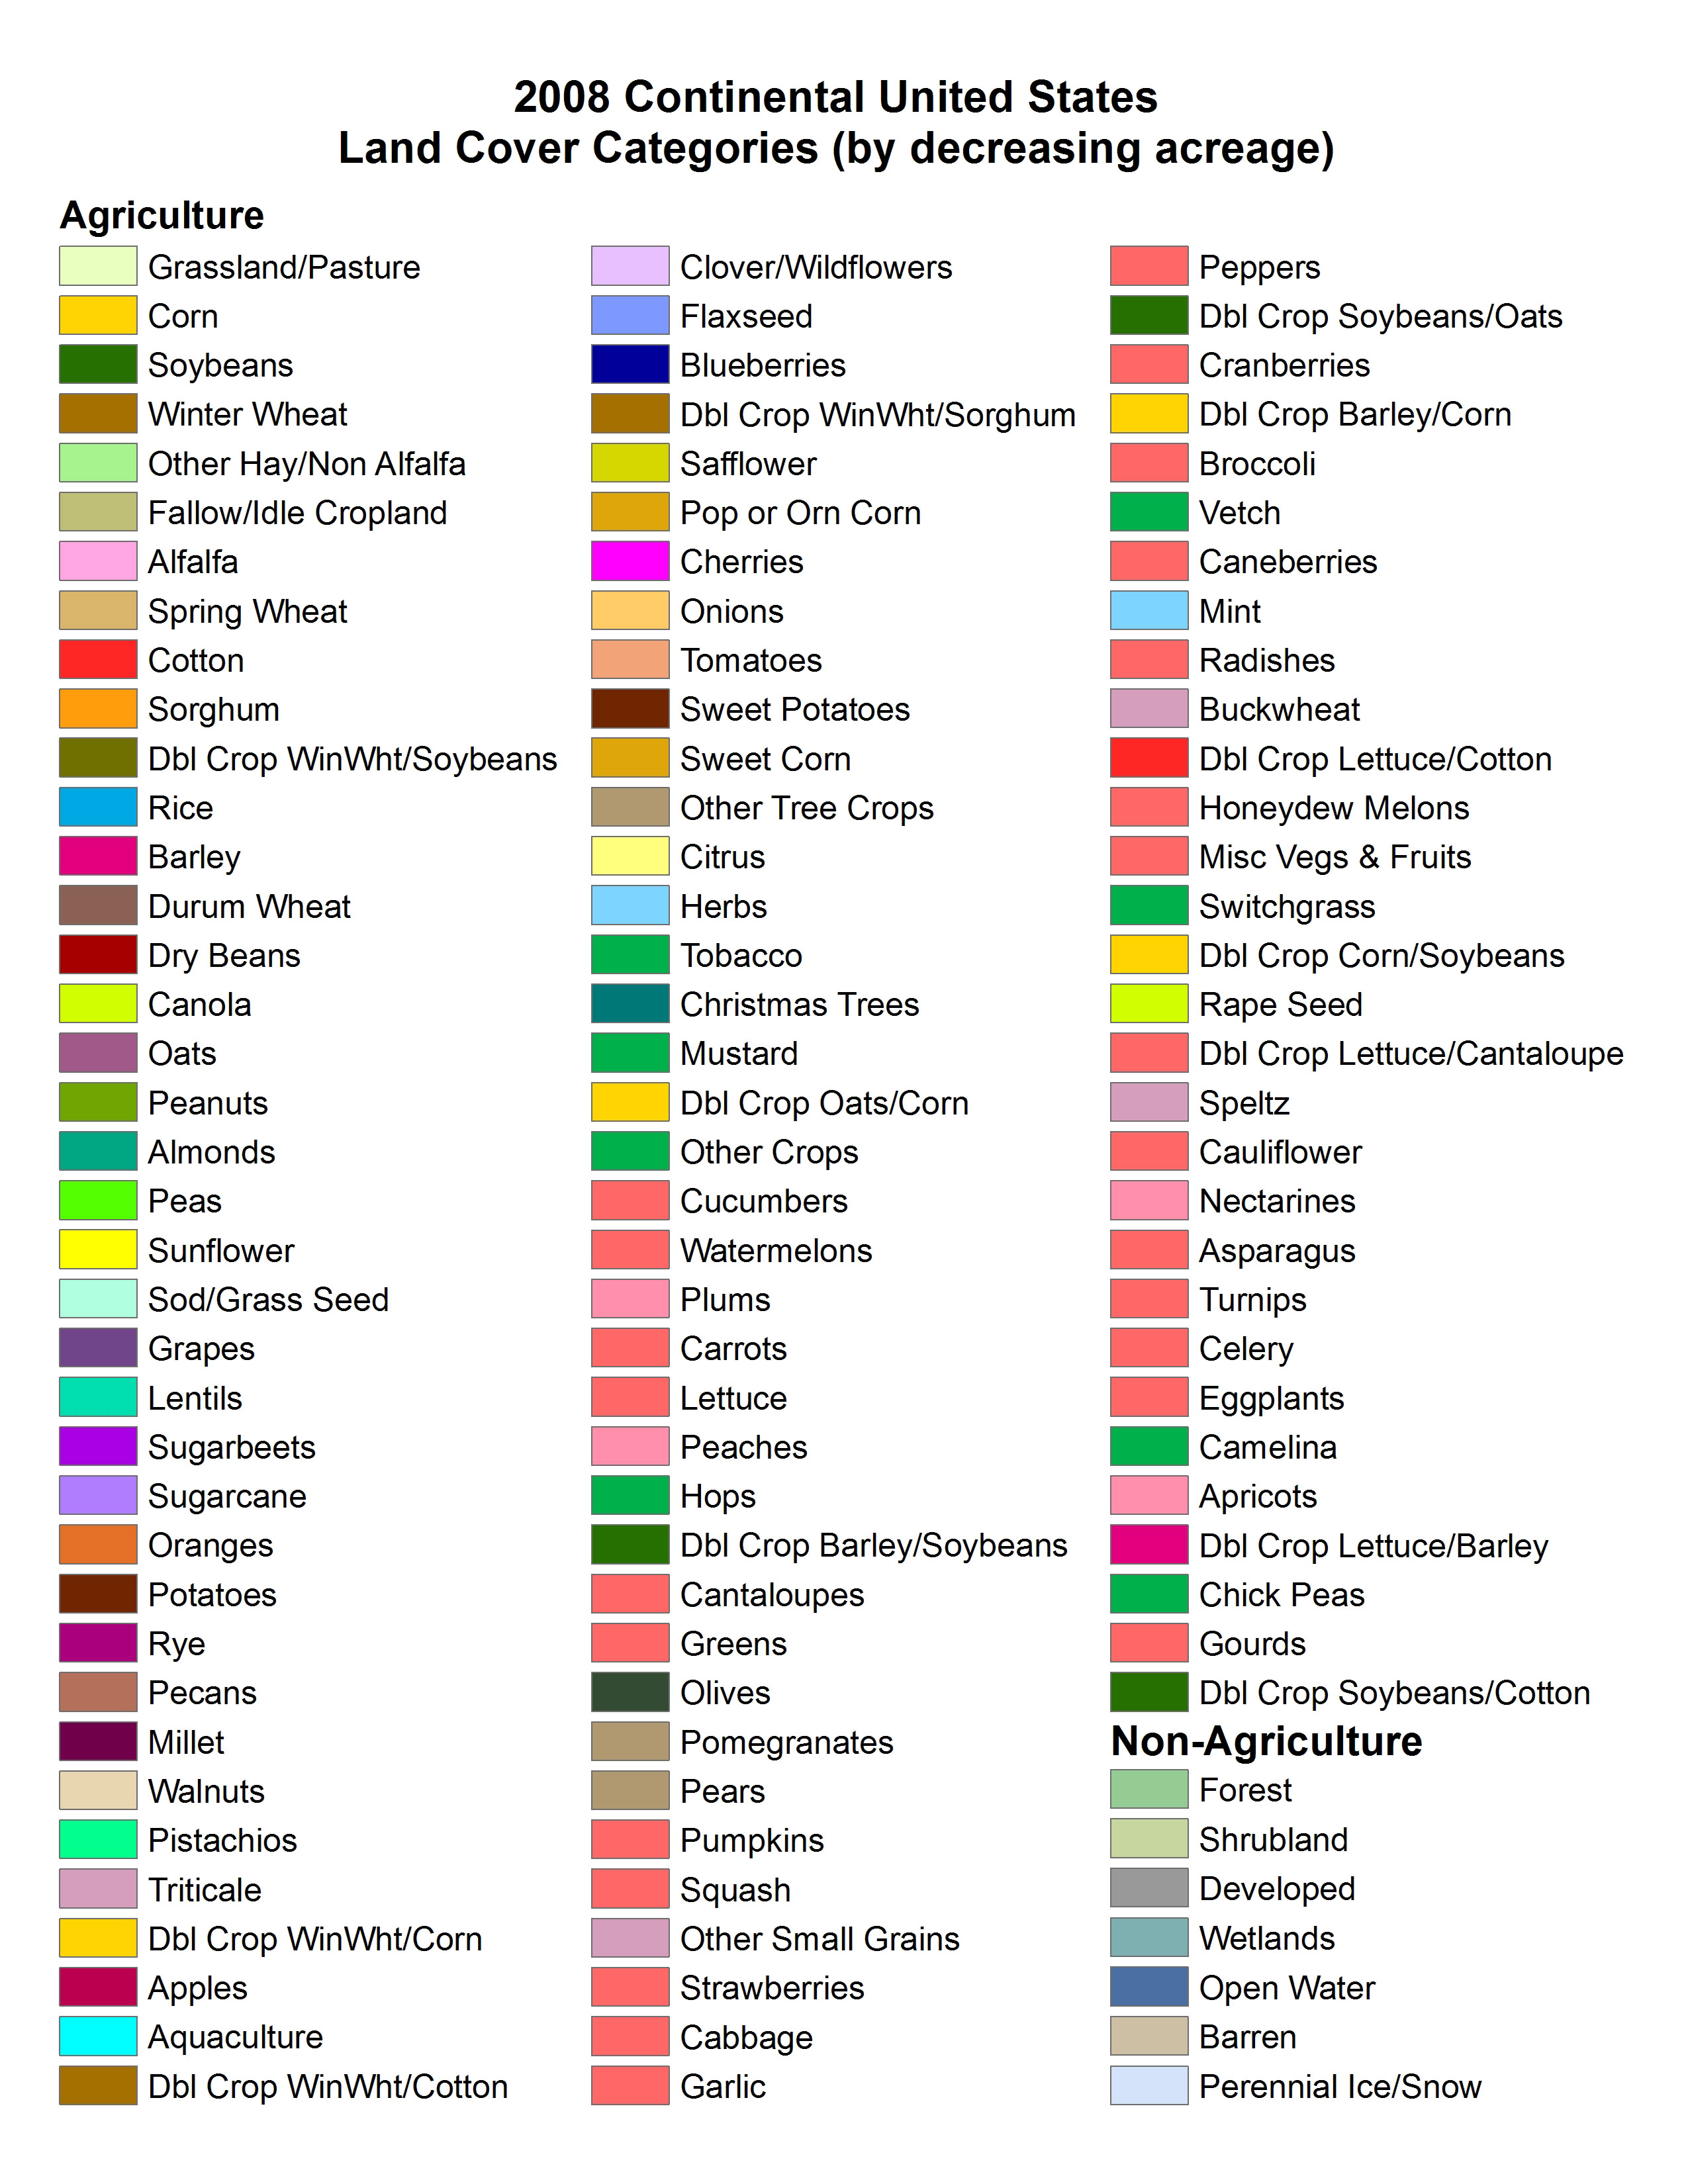
Last Modified: 04/11/2024