- Data & Statistics
Access Quick Stats (searchable database)
The Quick Stats Database is the most comprehensive tool for accessing agricultural data published by NASS. It allows you to customize your query by commodity, location, or time period.
Access Quick Stats Lite
Quick Stats Lite provides a more structured approach to get commonly requested statistics from our online database.
Explore Statistics
County Level Information
Geospatial Data & Interactive Maps
- Publications
Browse NASS Reports
- by Subject
- by Date (Reports Calendar)
- by Title/Release Day
- by Keyword
- Guide to Products and Services
Additional Reports
Historical Publications
- Archived Ag Census Reports (2002 and prior - published every 5 years)
- Annual Agricultural Statistics
- Statistical Bulletins (final estimates, 1987 to 2012
- Track Records: (crops, livestock, grain stocks)
- Trends 20th century
- Price Reactions (after crop or livestock reports)
Receive Reports by Email:
- Newsroom
News Releases
04/15/24 USDA NASS announces retirement of Administrator Hubert Hamer
03/28/24 United States hog inventory up 1%
03/28/24 US farmers expect to plant less corn and more soybean acres
03/26/24 USDA to host Data Users’ Meeting to gather public input on statistical programs
Read More News
ASB Notices
04/15/24 NASS appoints Lance Honig as new ASB Chair
04/09/24 NASS discontinues select 2024 data collection programs and reports
04/04/24 NASS announces program changes following five-year review
02/23/24 NASS Delays Cold Storage Data Release
12/19/23 NASS seeks public input during survey program review
Read More Notices
Videos
02/13/24 2022 Census of Agriculture Data Highlights
02/13/24 How to Find 2022 Census of Agriculture Data
02/13/24 2022 Census of Agriculture Data Release Event
07/16/21 What is a Farm?
08/05/20 The NASS Mission: We do it for you
View More Videos
ASB Briefings
04/17/24 National Hemp Report (April 2024)
04/11/24 Crop Production (April 2024)
03/28/24 Quarterly Hogs and Pigs (March 2024)
03/28/24 Grain Stocks, Prospective Plantings, Rice Stocks (March 2024)
03/08/24 Crop Production (March 2024)
View More Briefings
- Surveys
- Census
- About NASS
Structure and Organization
- Agency Overview
- NASS Biographies
- Organizational Chart
- Assistance to Other Organizations
- International Programs
- NASS Strategic Plan for FY 2022-2026
- USDA Strategic Goals
- NASS Climate Adaptation and Resilience Plan
Guiding Principles
- Mission and Core Values
- Keeping Data Safe
- Confidentiality Pledge
- Security Pledge
- Security Statement
- Statement of Commitment to Scientific Integrity
- Regulations Guiding NASS
- Information Quality
Civil Rights
- USDA and NASS Civil Rights Policy Statement
- Civil Rights Accountability Policy and Procedures
- No FEAR Act Notice
- No FEAR Act - NASS Data
-
REE Reasonable Accommodations and Personal Assistance Services
- NASS Disability Affirmative Action Plan
- How to File an EEO Complaint
- Contact information for NASS Civil Rights Office
Work at NASS
Education and Outreach
- Understanding Ag Statistics
- Data Users' Meetings
- Morris Hansen Lecture
- International Conference on Agricultural Statistics
History and Procedures
- Agricultural Statistics Board and Lockup
- Agricultural Statistics: A Historical Timeline
- The Story of U.S. Agricultural Estimates
- As We Recall: The Growth of Agricultural Estimates, 1933-1961
-
Safeguarding America's Agricultural Statistics Report and Video
- History of Ag Statistics
- Report Procedures
- An Evolving Statistical Service
- Fact Finders for Agriculture
- Hall of Fame
- Contact Us
Mailing Address:
USDA-NASS
1400 Independence Ave., SW
Washington, DC 20250Survey FAQs and Contact Us:
Access FAQs or submit a question.
Data Inquiries:
Hours: 7:30 a.m. - 4:00 p.m. Eastern Time
Monday - Friday, except federal holidays
Toll-Free: (800) 727-9540Media Inquiries:
Other USDA Inquiries:
Hours: 9:00 a.m. - 5:30 p.m. Eastern Time
Monday - Friday, except federal holidays
Toll-Free: (833) One-USDA
Email: askusda@usda.gov
Website: https://ask.usda.gov/s/Civil Rights Office:
June Turner, Director
Email: / Phone: (202) 720-8257Regional and State Field Offices:
Find contact information for Regional and State Field Offices
Ask a Specialist:
Have a specific question for one of our subject experts? Contact a specialist.
Web Content Publishing Schedule:
Section 207(f)(2) of the E-Government Act of 2002 requires federal agencies to develop an inventory of information to be published on their Web sites, establish a schedule for publishing information, make those schedules available for public comment, and post the schedules and priorities on the Web site.
- Help
Technical Issues
No. 2018-1 | 2018 Crop Highlights
Crop Highlights
(based on January 2018 reports)
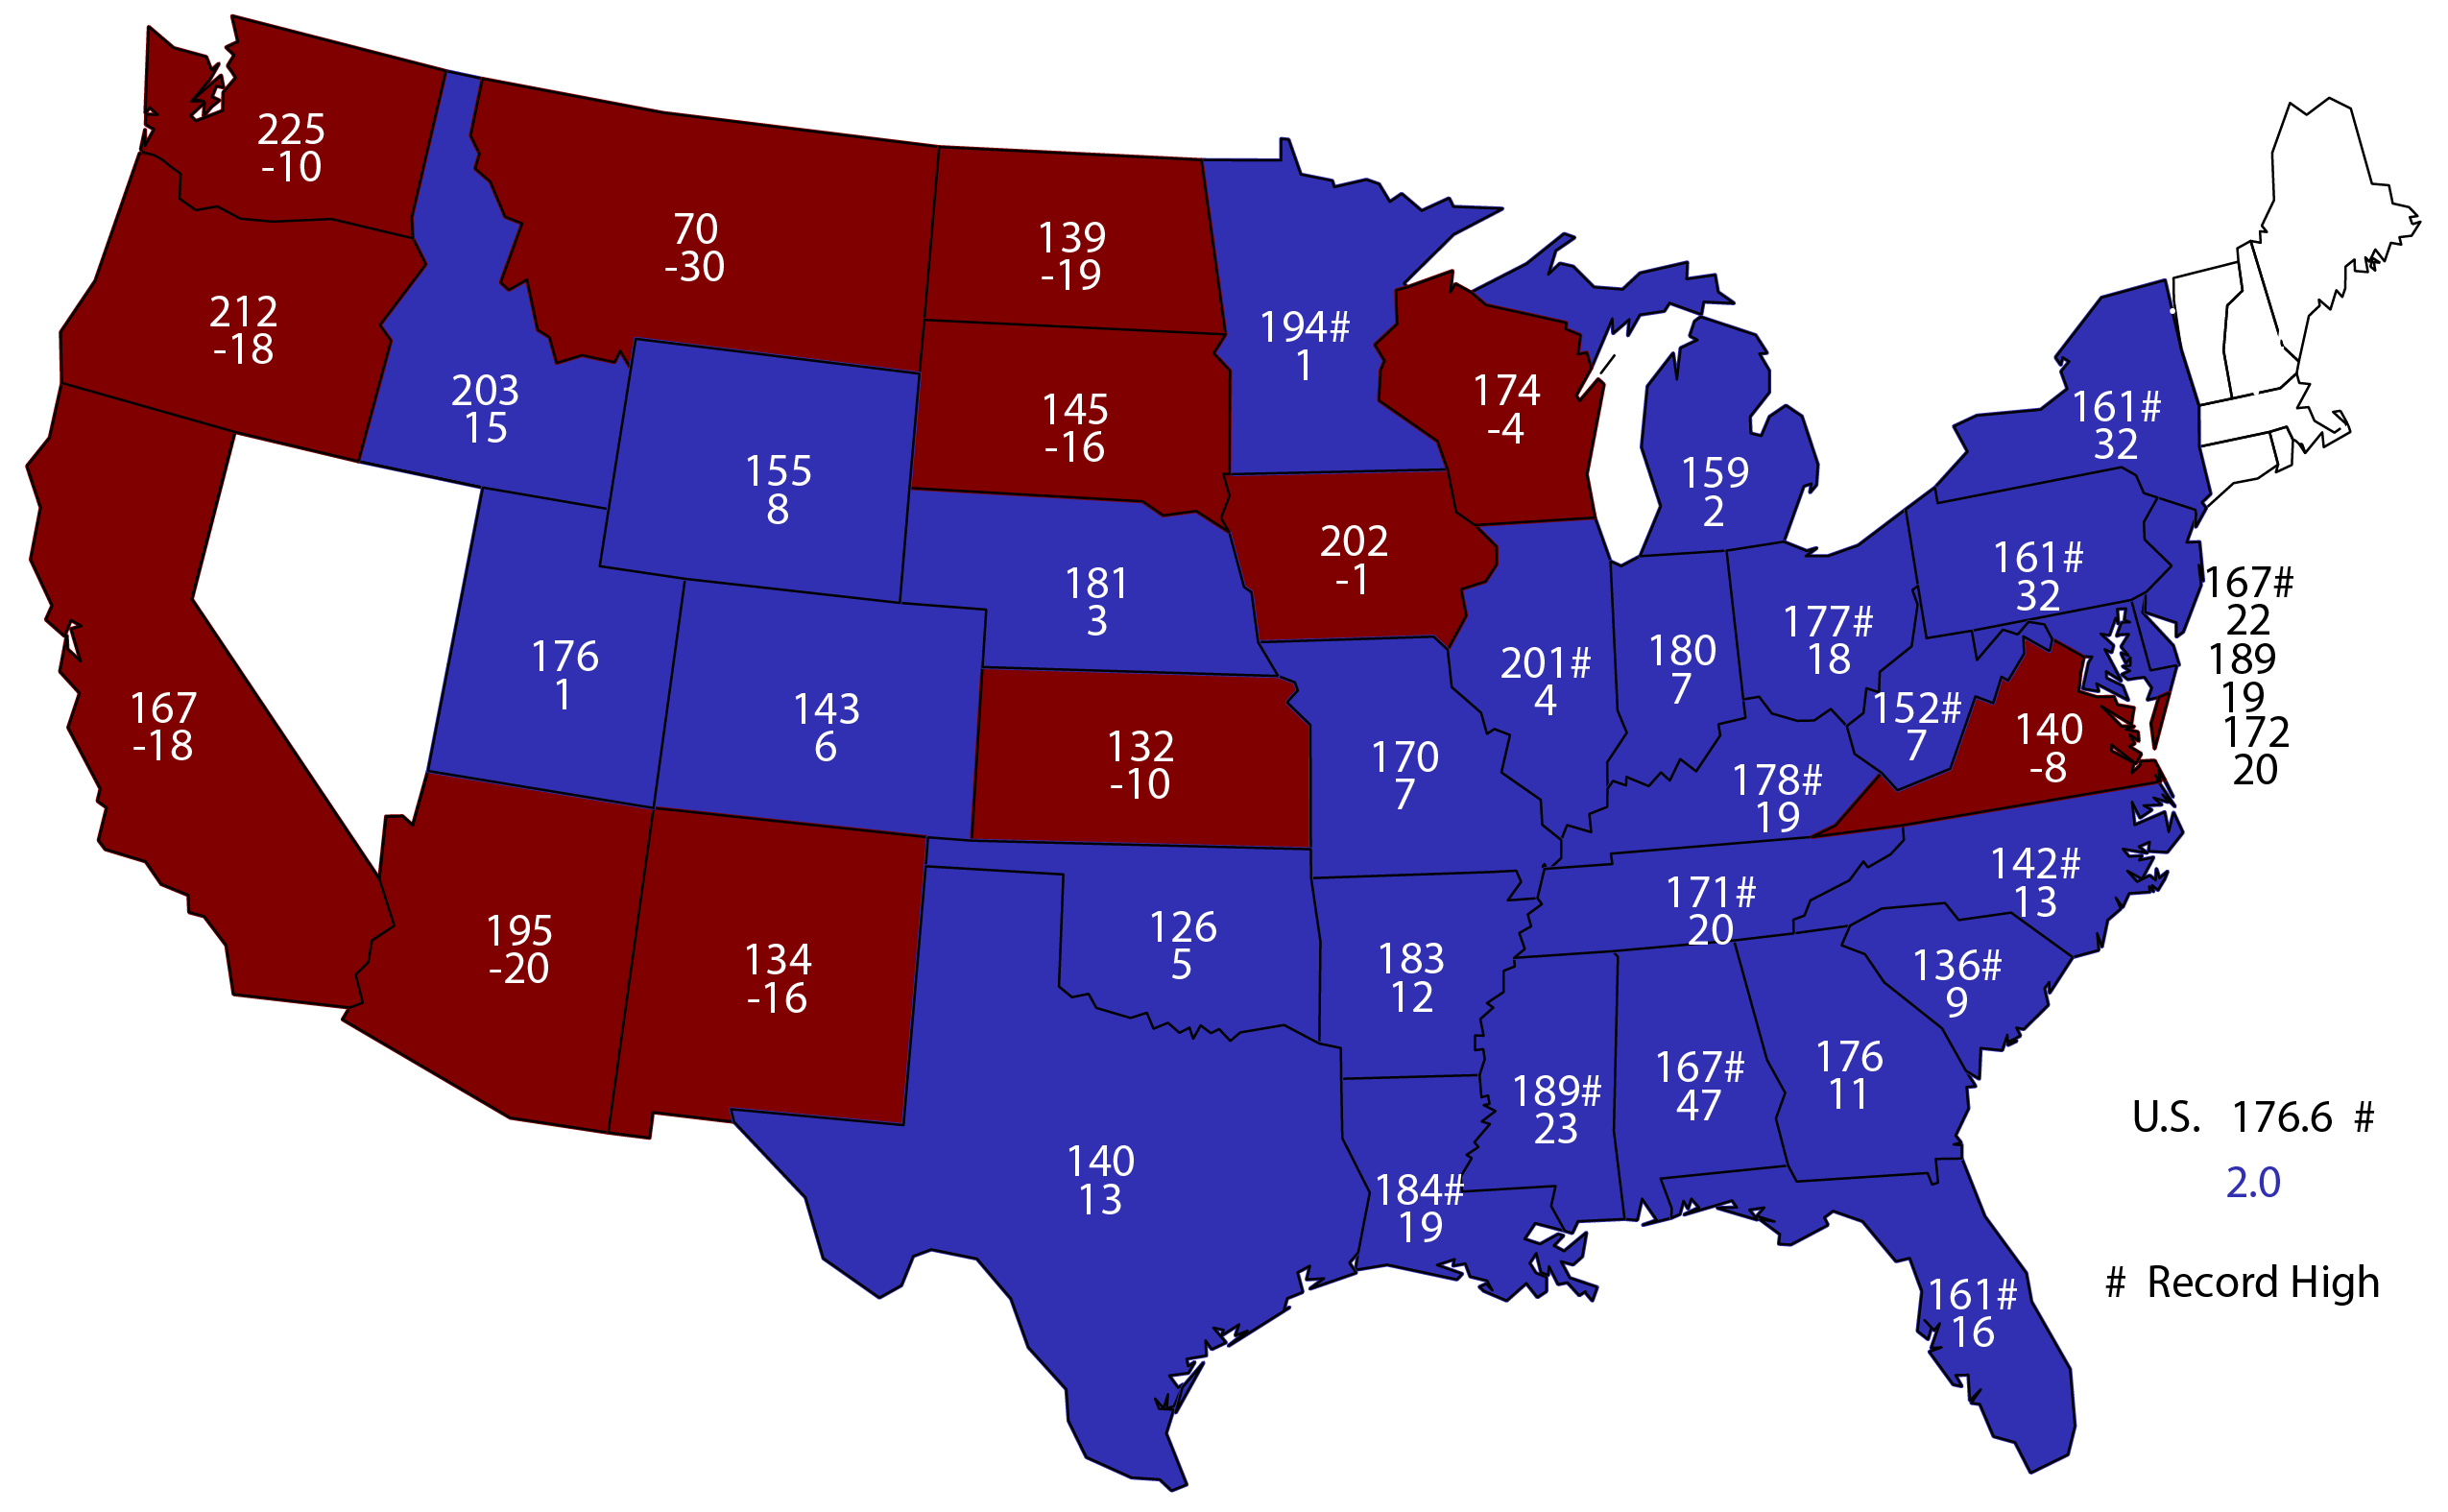
- Red = yield decrease
- Blue = yield increase
- White = not estimated
- Top number = average bushels per acre
- Bottom number = average bushels per acre increase or decrease from 2016
2017 Corn Yield
bushels per acre and change from 2016
Across the Midwest, a lack of extreme heat helped boost the nation's corn yield to its highest level on record – slightly above 2016. U.S. corn growers produced 14.6 billion bushels in 2017, down 4 percent from 2016. Average corn yield in 2017 was estimated at a record high 176.6 bushels per acre, 2.0 bushels more than the 2016 average yield of 174.6 bushels per acre. Area harvested, at 82.7 million acres, was down 5 percent from 2016.
2017 Soybean Yield
bushels per acre and change from 2016
U.S. soybean production for 2017 totaled a record 4.39 billion bushels, up 2 percent from 2016. With record high levels across much of the southern United States, from the Delta to the Appalachian Mountains, the average soybean yield in 2017 was estimated at 49.1 bushels per acre, 2.9 bushels less than 2016's record average yield. Harvested area in 2017 was a record 89.5 million acres, up 8 percent from 2016.
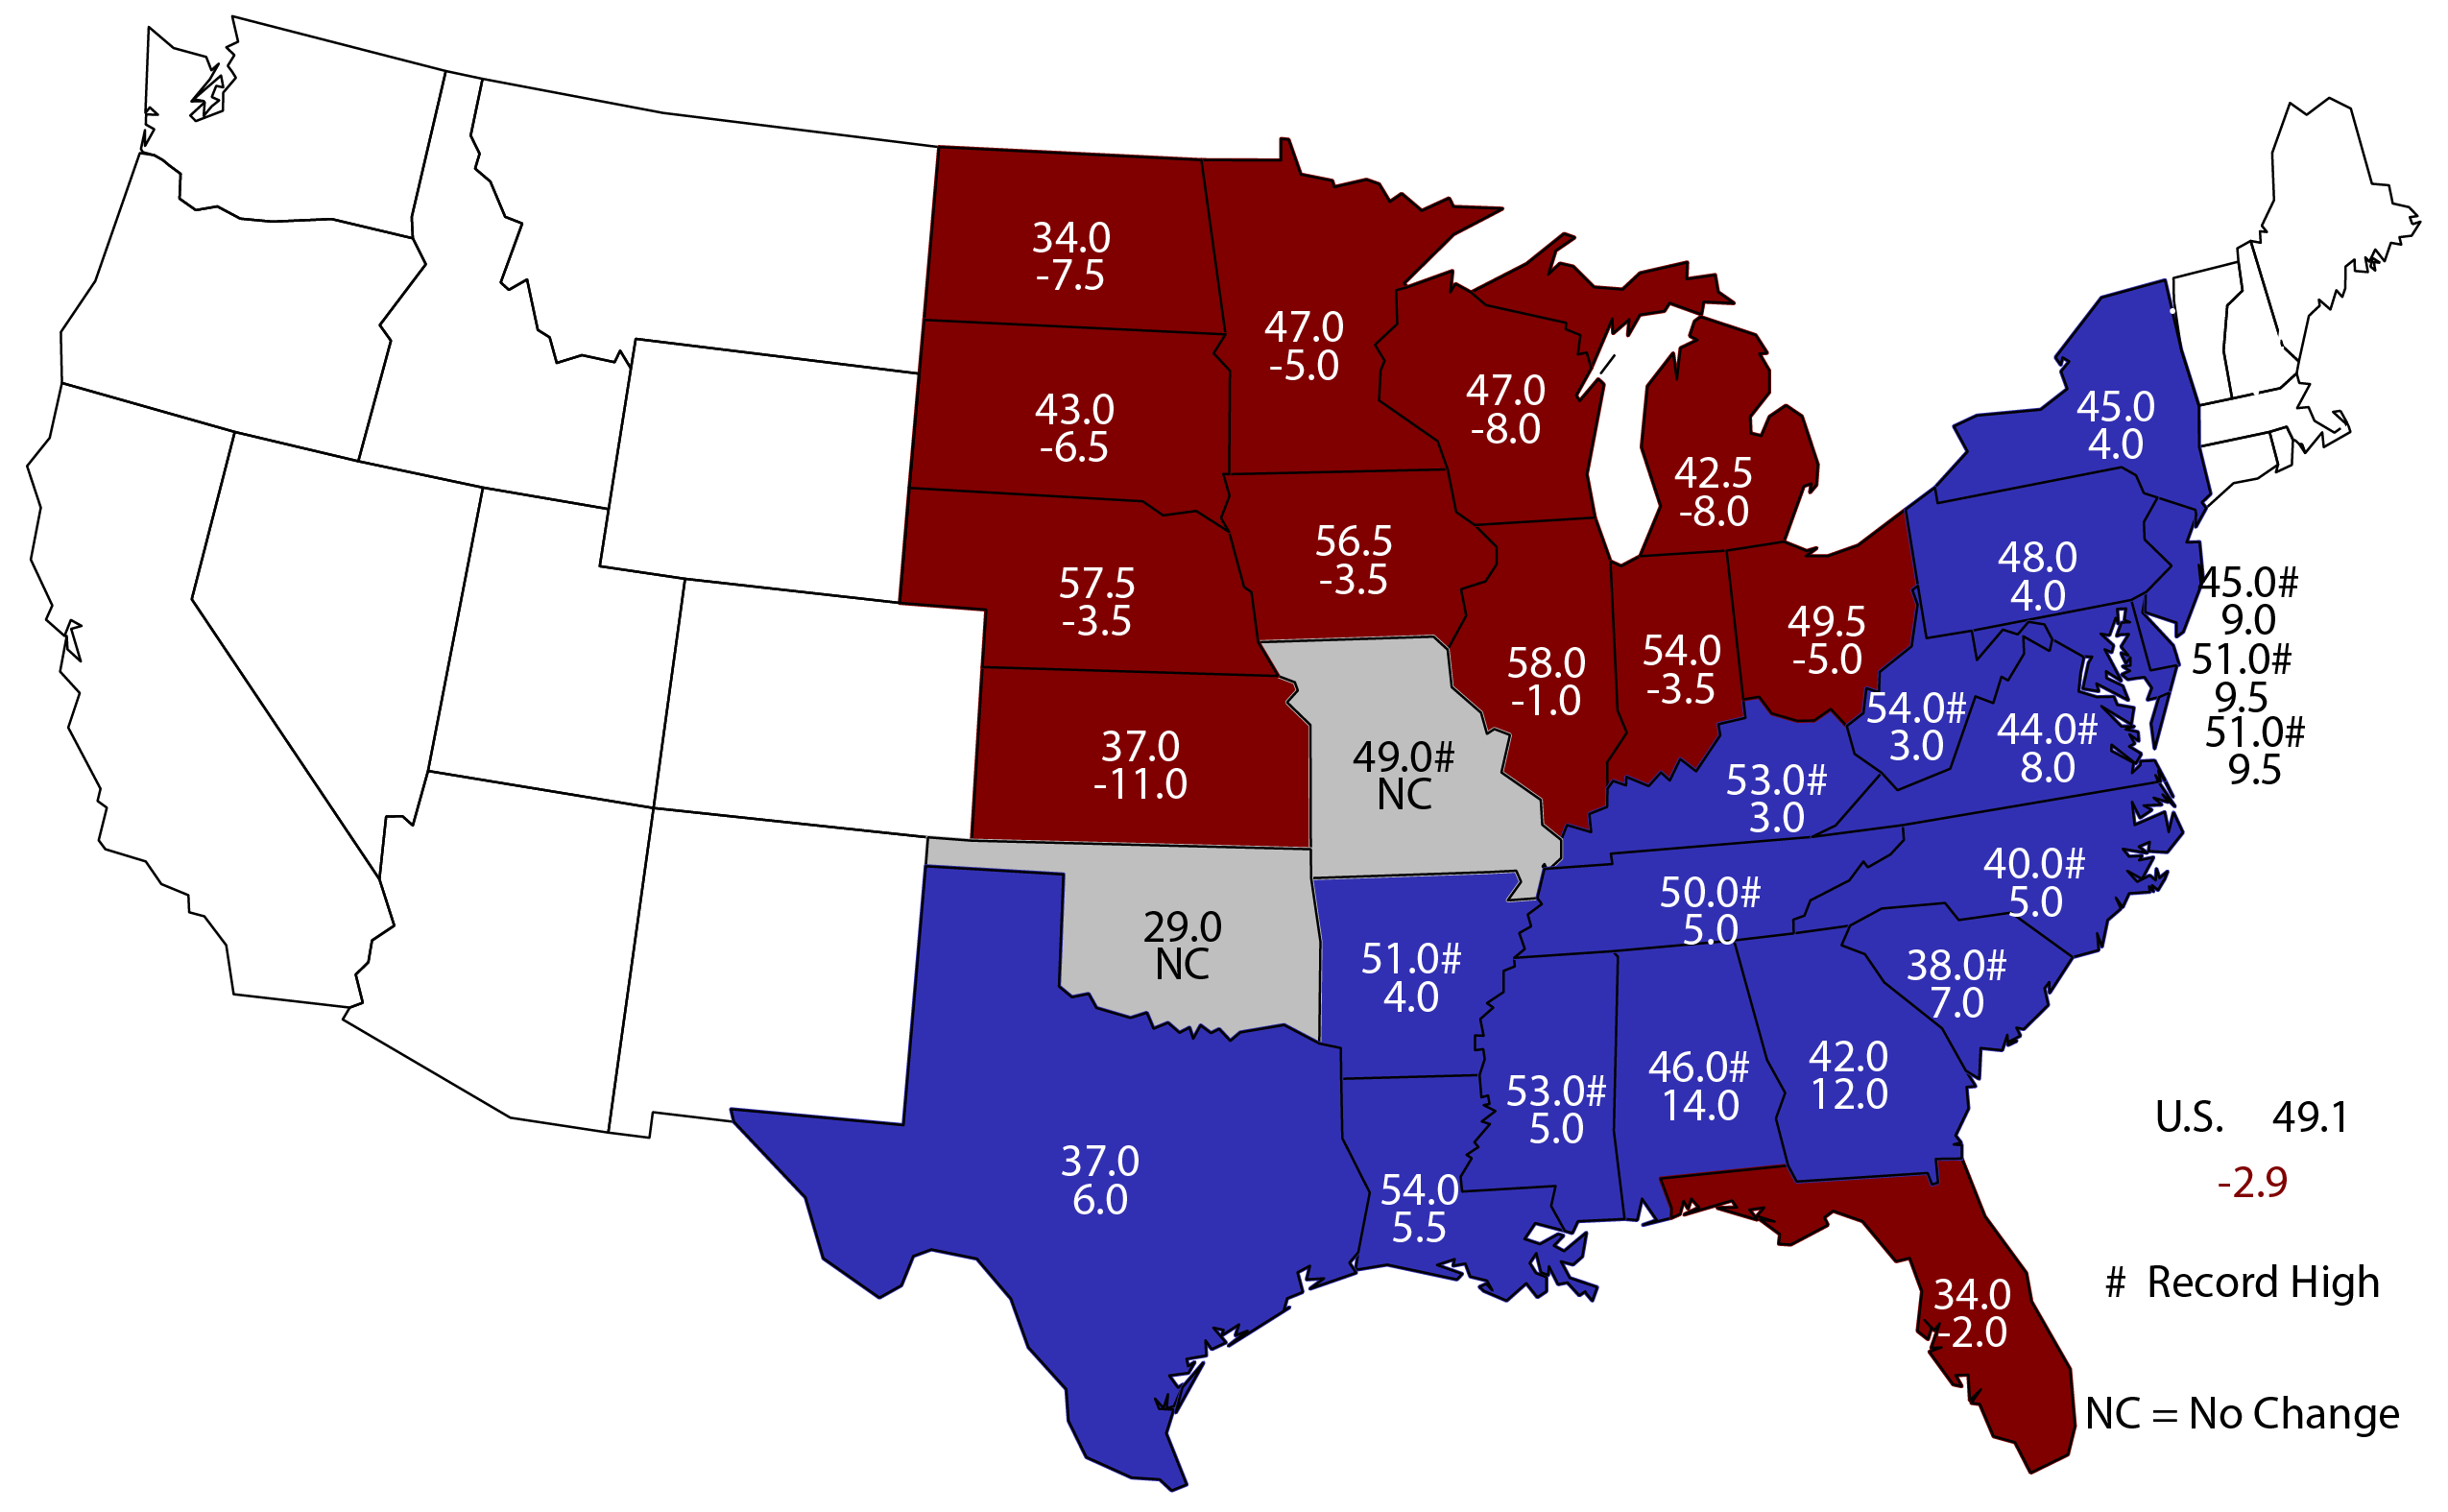
- Red = yield decrease
- Blue = yield increase
- Grey = no change in yield
- White = not estimated
- Top number = average bushels per acre
- Bottom number = average bushels per acre increase or decrease from 2016
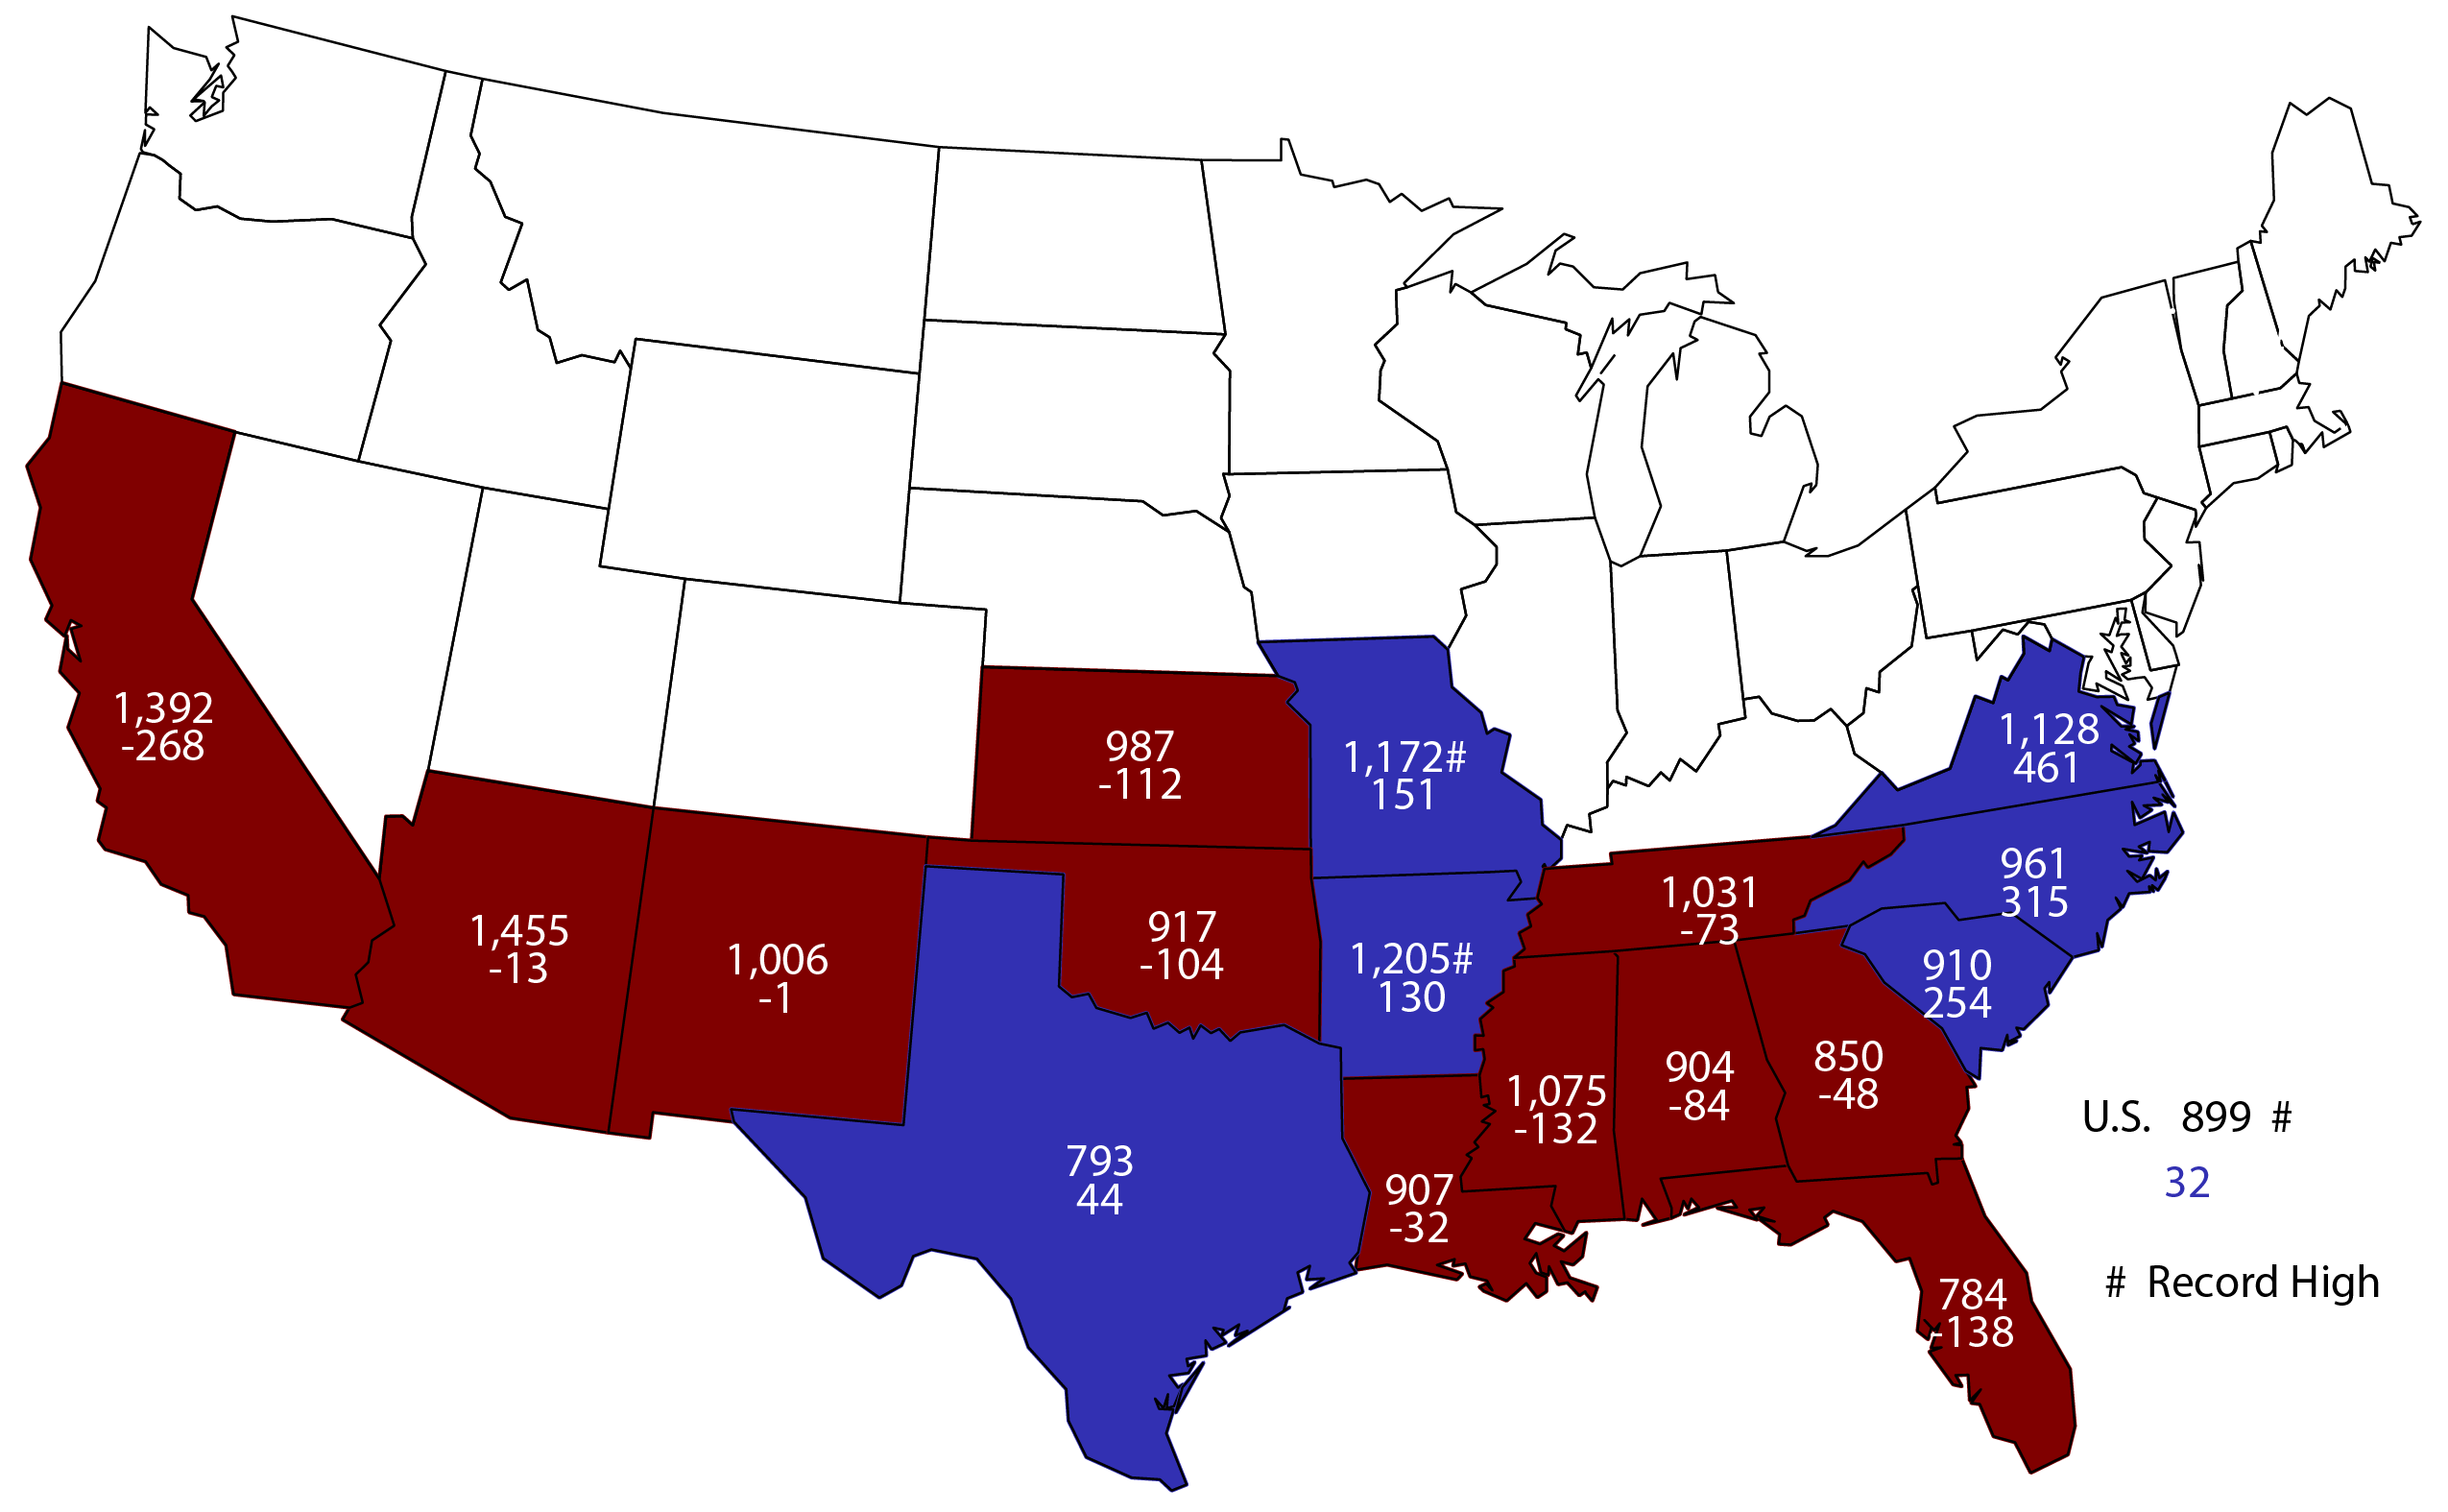
- Red = yield decrease
- Blue = yield increase
- White = not estimated
- Top number = average pounds per acre
- Bottom number = average pounds per acre increase or decrease from 2016
2017 All Cotton Yield
pounds per acre and change from 2016
For 2017, U.S. production of all cotton totaled 21.3 million 480-pound bales, up 24 percent from 2016. Average yield is estimated at 899 pounds per acre, up 32 pounds from 2016. Harvested area, at 11.3 million acres, was up 19 percent from 2016.
2018 Winter Wheat Planted Area
thousands of acres and change from 2017
The Winter Wheat and Canola Seedings report is the first indicator of 2018 winter wheat acreage. Planted area for harvest in 2018 is estimated at 32.6 million acres, down less than 1 percent from 2017 and down 10 percent from 2016. This represents the second lowest U.S. winter wheat acreage on record.
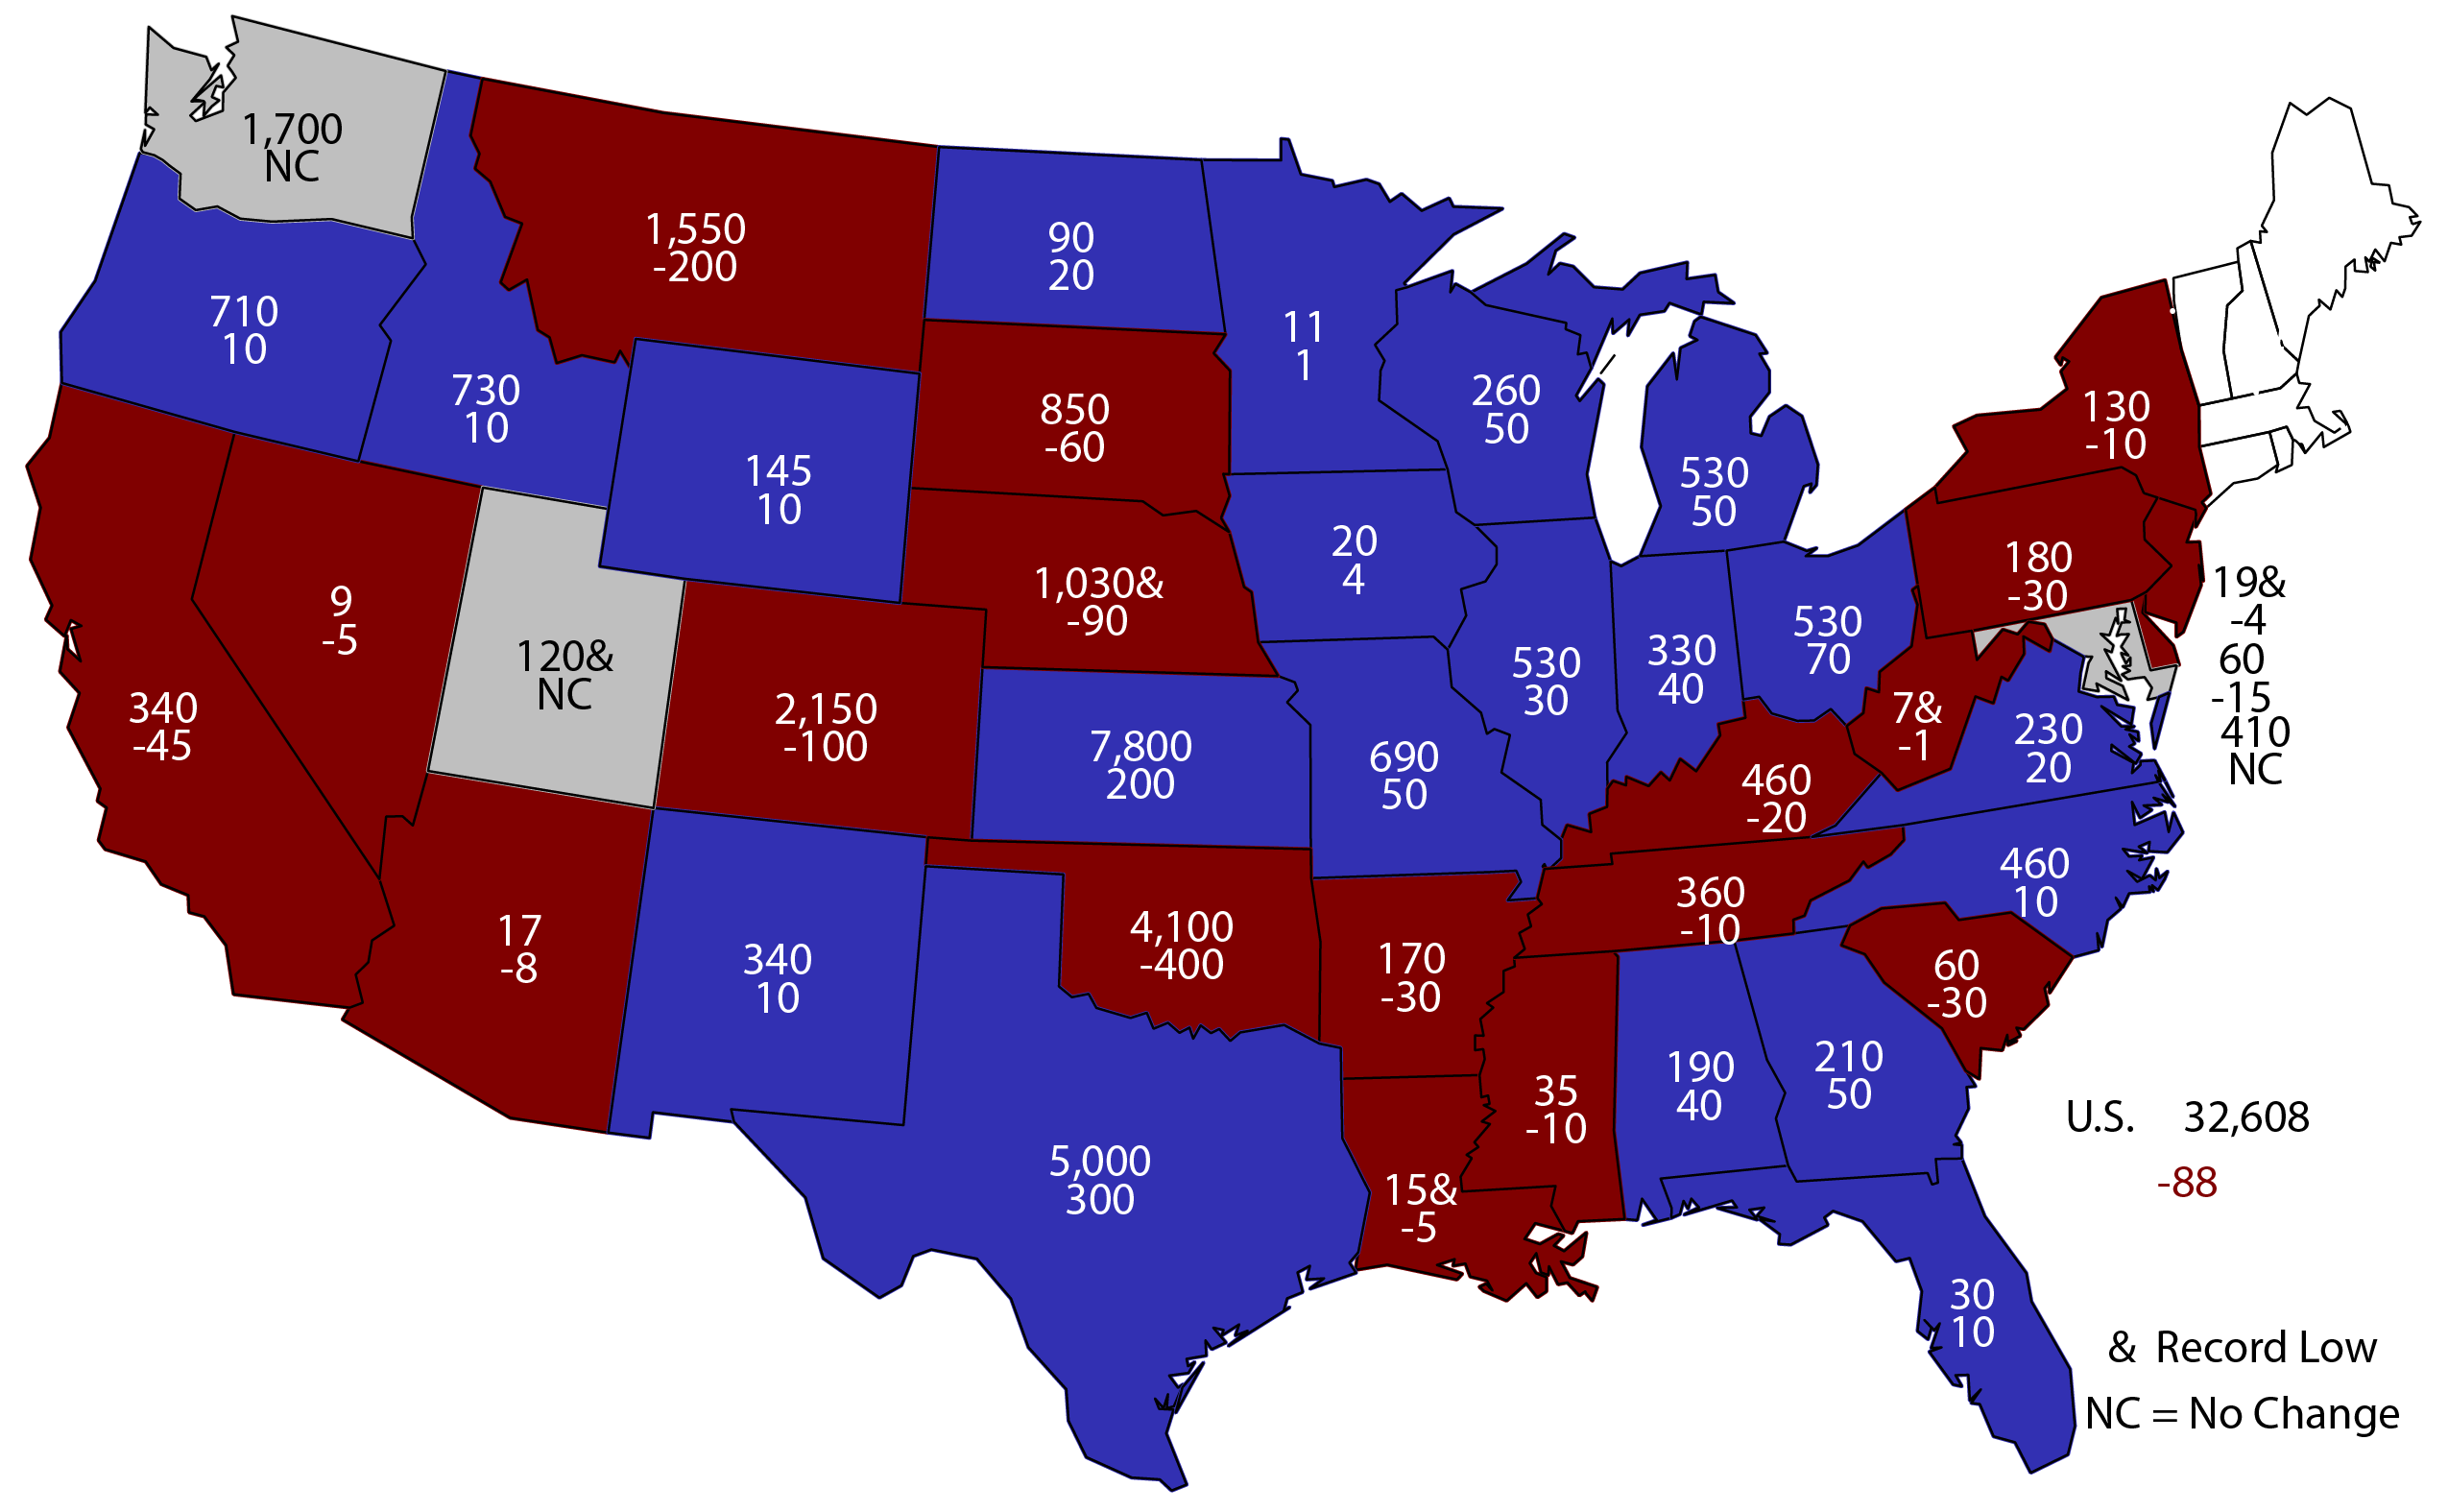
- Red = acres planted decrease
- Blue = acres planted increase
- Grey = no change in acres planted
- White = not estimated
- Top number = acres planted
- Bottom number = acres planted increase or decrease from 2017
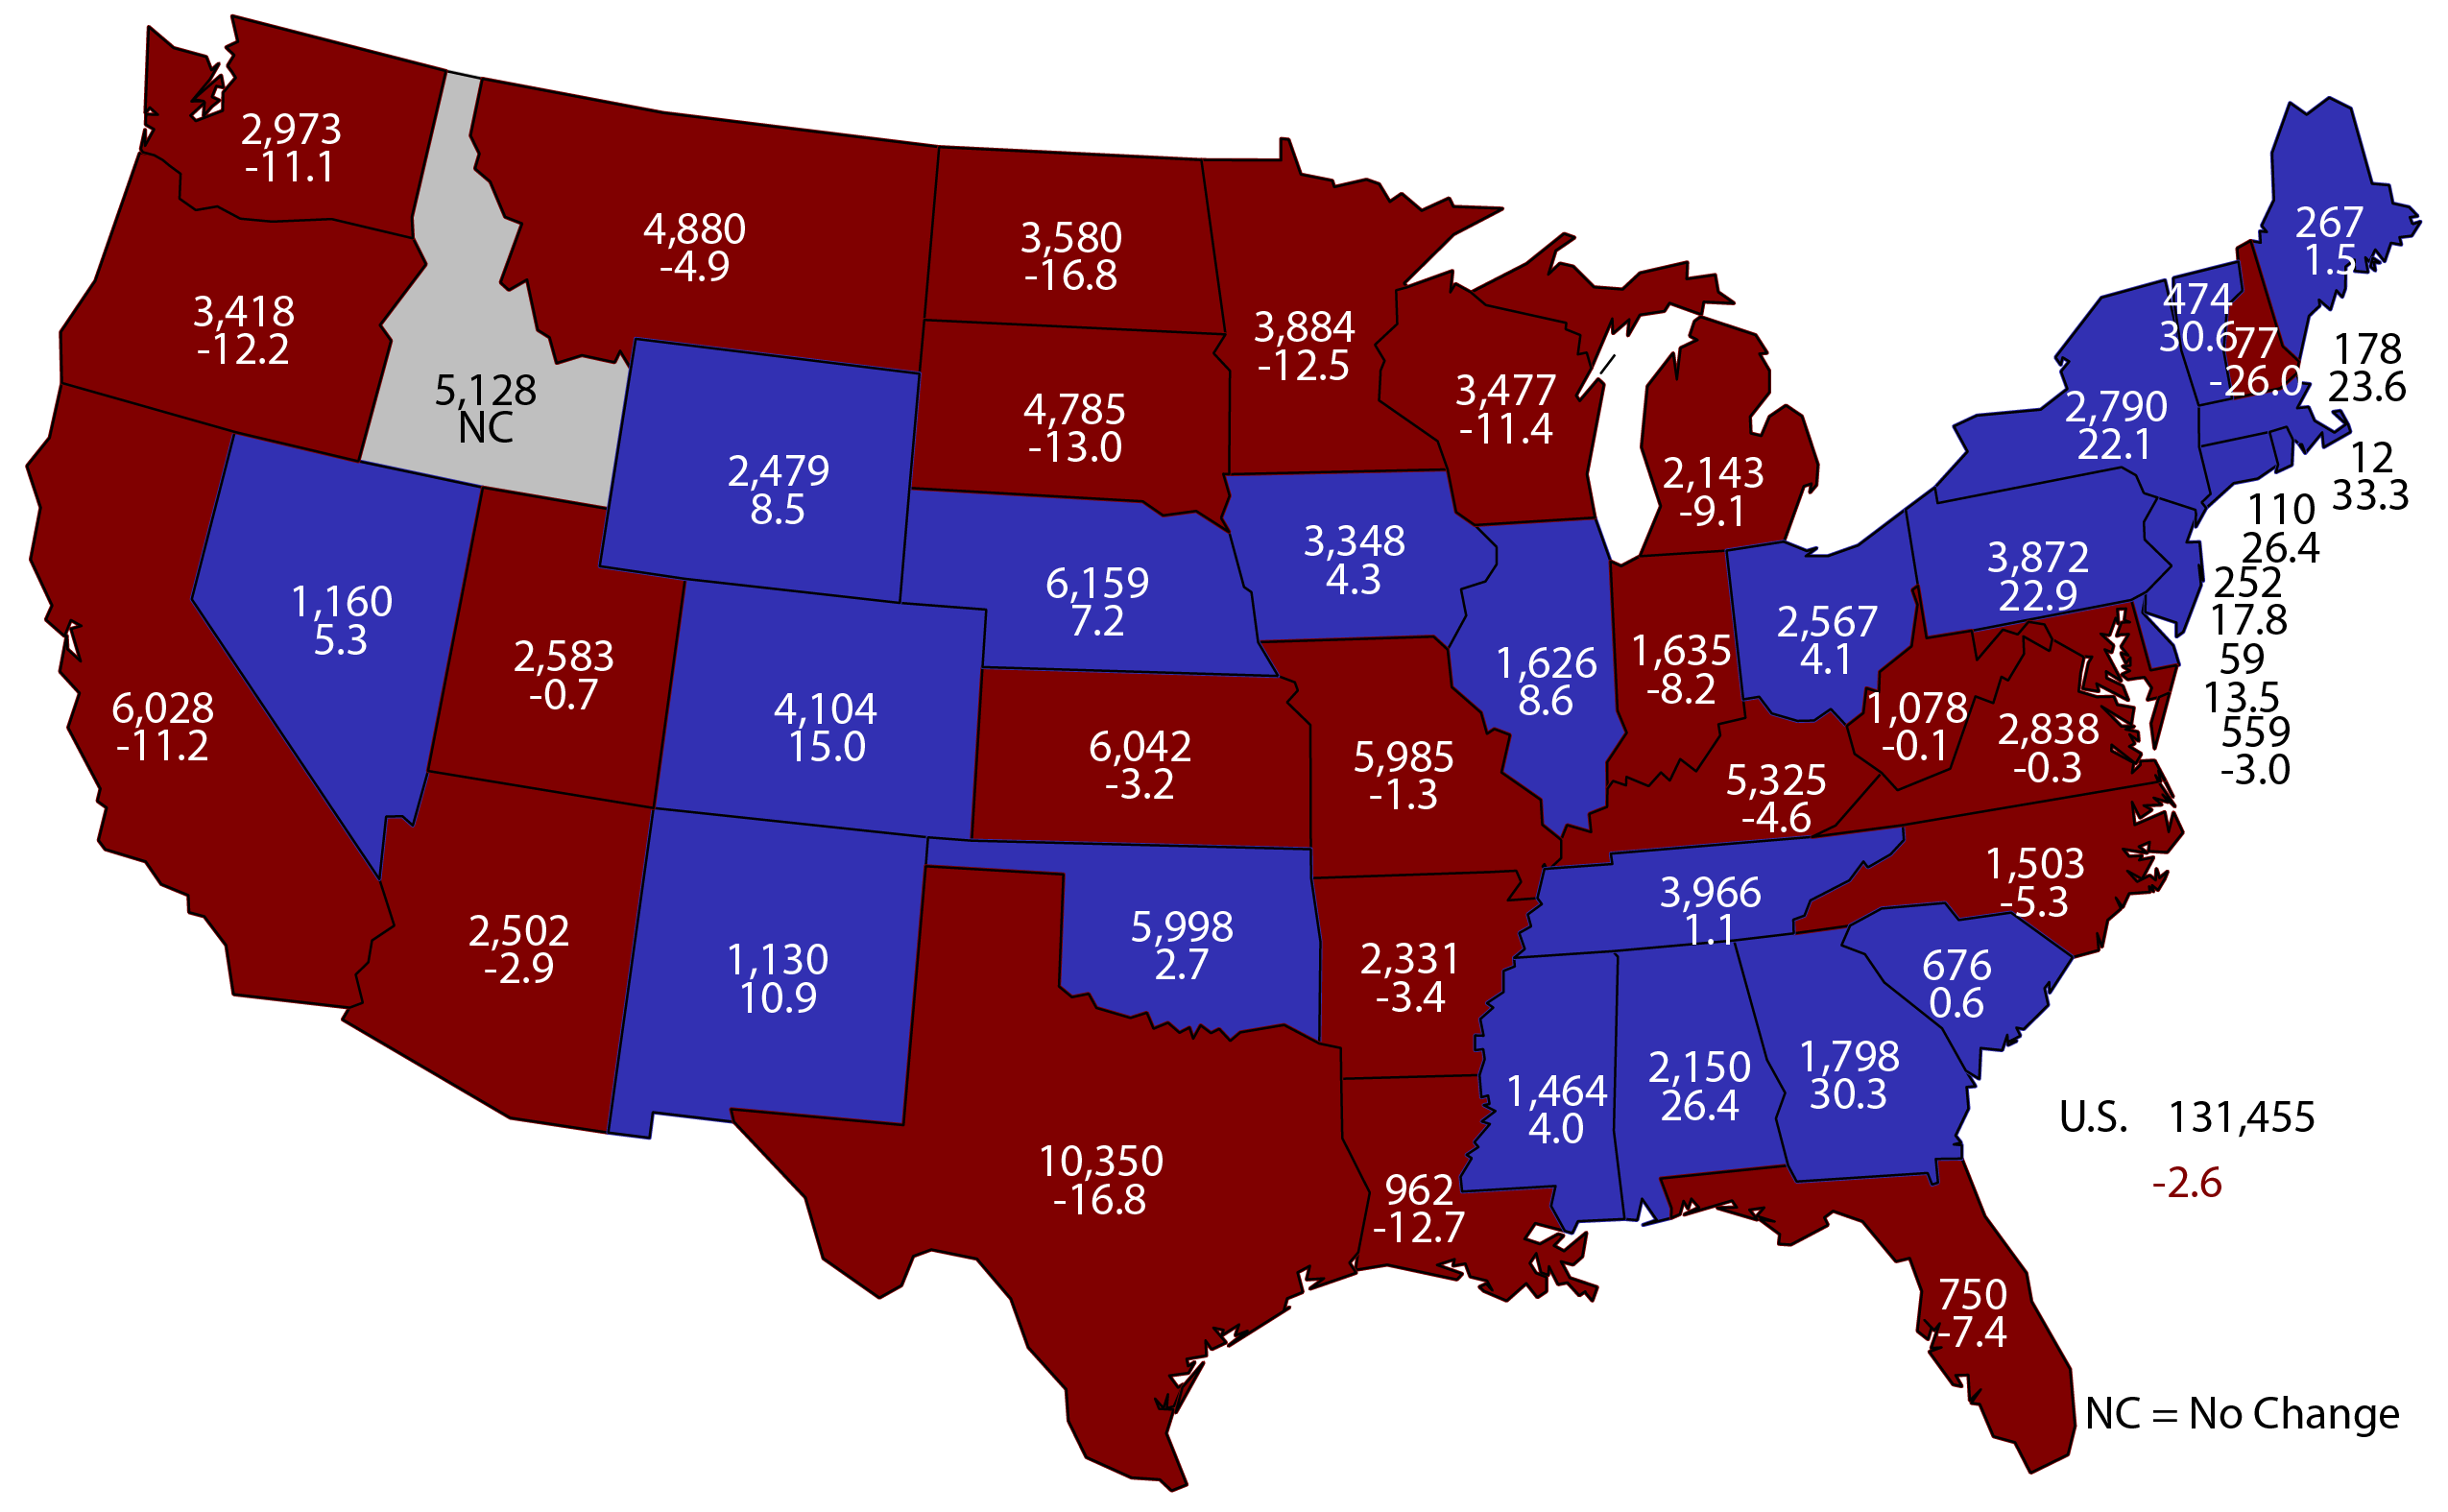
- Red = decrease in thousands of tons
- Blue = increase in thousands of tons
- Grey = no change in production
- Top number = total production in thousands of tons
- Bottom number = percent change from 2016
2017 Hay Production
thousands of tons and percent change from 2016
Production of all dry hay for 2017 was estimated at 131 million tons, down 3 percent from the 2016 total. Area harvested was estimated at 53.8 million acres, up 1 percent from 2016. The average yield in 2017, at 2.44 tons per acre, was down 0.08 ton from 2016. All hay harvested acres was the second lowest since 1908 (the lowest was in 2016).
You can explore the full January 12 Crop Production 2017 Summary and Winter Wheat and Canola Seedings reports. View some of the data on a data visualization available from your desktop, or access all data on the online searchable database Quick Stats.
Last Modified: 11/19/2018