- Data & Statistics
Access Quick Stats (searchable database)
The Quick Stats Database is the most comprehensive tool for accessing agricultural data published by NASS. It allows you to customize your query by commodity, location, or time period.
Access Quick Stats Lite
Quick Stats Lite provides a more structured approach to get commonly requested statistics from our online database.
Explore Statistics
County Level Information
Geospatial Data & Interactive Maps
- Publications
Browse NASS Reports
- by Subject
- by Date (Reports Calendar)
- by Title/Release Day
- by Keyword
- Guide to Products and Services
Additional Reports
Historical Publications
- Archived Ag Census Reports (2002 and prior - published every 5 years)
- Annual Agricultural Statistics
- Statistical Bulletins (final estimates, 1987 to 2012
- Track Records: (crops, livestock, grain stocks)
- Trends 20th century
- Price Reactions (after crop or livestock reports)
Receive Reports by Email:
- Newsroom
News Releases
04/15/24 USDA NASS announces retirement of Administrator Hubert Hamer
03/28/24 United States hog inventory up 1%
03/28/24 US farmers expect to plant less corn and more soybean acres
03/26/24 USDA to host Data Users’ Meeting to gather public input on statistical programs
Read More News
ASB Notices
04/15/24 NASS appoints Lance Honig as new ASB Chair
04/09/24 NASS discontinues select 2024 data collection programs and reports
04/04/24 NASS announces program changes following five-year review
02/23/24 NASS Delays Cold Storage Data Release
12/19/23 NASS seeks public input during survey program review
Read More Notices
Videos
02/13/24 2022 Census of Agriculture Data Highlights
02/13/24 How to Find 2022 Census of Agriculture Data
02/13/24 2022 Census of Agriculture Data Release Event
07/16/21 What is a Farm?
08/05/20 The NASS Mission: We do it for you
View More Videos
ASB Briefings
04/17/24 National Hemp Report (April 2024)
04/11/24 Crop Production (April 2024)
03/28/24 Quarterly Hogs and Pigs (March 2024)
03/28/24 Grain Stocks, Prospective Plantings, Rice Stocks (March 2024)
03/08/24 Crop Production (March 2024)
View More Briefings
- Surveys
- Census
- About NASS
Structure and Organization
- Agency Overview
- NASS Biographies
- Organizational Chart
- Assistance to Other Organizations
- International Programs
- NASS Strategic Plan for FY 2022-2026
- USDA Strategic Goals
- NASS Climate Adaptation and Resilience Plan
Guiding Principles
- Mission and Core Values
- Keeping Data Safe
- Confidentiality Pledge
- Security Pledge
- Security Statement
- Statement of Commitment to Scientific Integrity
- Regulations Guiding NASS
- Information Quality
Civil Rights
- USDA and NASS Civil Rights Policy Statement
- Civil Rights Accountability Policy and Procedures
- No FEAR Act Notice
- No FEAR Act - NASS Data
-
REE Reasonable Accommodations and Personal Assistance Services
- NASS Disability Affirmative Action Plan
- How to File an EEO Complaint
- Contact information for NASS Civil Rights Office
Work at NASS
Education and Outreach
- Understanding Ag Statistics
- Data Users' Meetings
- Morris Hansen Lecture
- International Conference on Agricultural Statistics
History and Procedures
- Agricultural Statistics Board and Lockup
- Agricultural Statistics: A Historical Timeline
- The Story of U.S. Agricultural Estimates
- As We Recall: The Growth of Agricultural Estimates, 1933-1961
-
Safeguarding America's Agricultural Statistics Report and Video
- History of Ag Statistics
- Report Procedures
- An Evolving Statistical Service
- Fact Finders for Agriculture
- Hall of Fame
- Contact Us
Mailing Address:
USDA-NASS
1400 Independence Ave., SW
Washington, DC 20250Survey FAQs and Contact Us:
Access FAQs or submit a question.
Data Inquiries:
Hours: 7:30 a.m. - 4:00 p.m. Eastern Time
Monday - Friday, except federal holidays
Toll-Free: (800) 727-9540Media Inquiries:
Other USDA Inquiries:
Hours: 9:00 a.m. - 5:30 p.m. Eastern Time
Monday - Friday, except federal holidays
Toll-Free: (833) One-USDA
Email: askusda@usda.gov
Website: https://ask.usda.gov/s/Civil Rights Office:
June Turner, Director
Email: / Phone: (202) 720-8257Regional and State Field Offices:
Find contact information for Regional and State Field Offices
Ask a Specialist:
Have a specific question for one of our subject experts? Contact a specialist.
Web Content Publishing Schedule:
Section 207(f)(2) of the E-Government Act of 2002 requires federal agencies to develop an inventory of information to be published on their Web sites, establish a schedule for publishing information, make those schedules available for public comment, and post the schedules and priorities on the Web site.
- Help
Technical Issues
Highlights
2013 Land Values and Cash Rents - Cropland and Pasture
October 2013 | No. 2013-3 | Download pdf version
The National Agricultural Statistics Service (NASS) estimated 2013 agricultural land values from data collected in the June Area Survey during the first two weeks of June, when NASS enumerators interviewed producers on approximately 9,900 land segments.
NASS estimated 2013 cash rents based on data collected during the 2013 June Area Survey and the 2013 Cash Rents Survey, conducted in spring in all states except Alaska. The Cash Rents Survey collected data on rental rates producers pay for irrigated cropland, non-irrigated cropland, and pasture land.
Agricultural Land Values
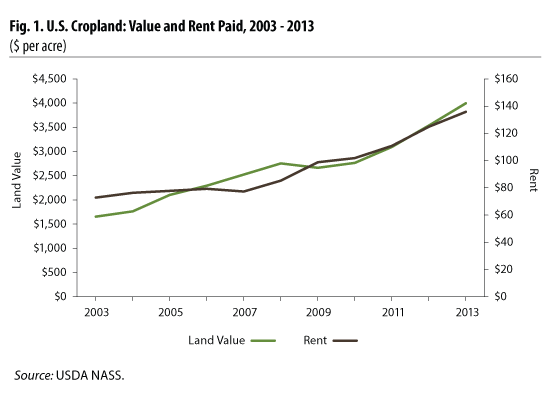
In 2013, the average value of U.S. cropland (including both irrigated and nonirrigated land) was $4,000 per acre, an increase of $460 per acre, or 13 percent, since 2012. The increase is more than 240 percent since 2003, when the average value per acre was $1,660 (Fig. 1).
At the state level, the value of cropland in 2013 ranged from $888 per acre in Montana to $10,190 per acre in California and $12,800 per acre in New Jersey.
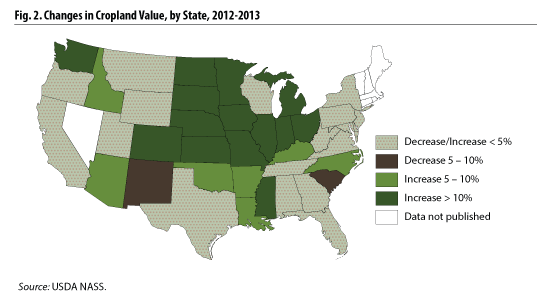
In much of the country, the change in cropland value (increase or decrease) between 2012 and 2013 was less than 5 percent. In fourteen states, cropland increased more than 10 percent in value, including three (Colorado, North Dakota, South Dakota) in which the crease was more than 20 percent. (Fig. 2)
Pasture land also increased in value for the United States. The average value in 2013 was $1,200 per acre, an increase of 4.3 percent since 2012, when the average per acre value in the United States was $1,150. The value of pasture land in 2013 ranged from $350 per acre in New Mexico to $13,400 in New Jersey.
Rent Paid for Agricultural Land
Nationally, in 2013, producers paid an average of $136 per acre to rent cropland (including both irrigated and nonirrigated land). This is an increase of $11 or 8.8 percent since 2012, and nearly double the $73 per acre in 2003 (Fig. 1).
For irrigated cropland, producers paid an average of $202 per acre, an 8 percent increase over the $187 per acre they paid in 2012. For pasture land, rental rates increased from $11.50 per acre in 2012 to $12 per acre in 2013.
Among states, the rental cost per acre in 2013 ranged from $31.50 in Montana to $280 in California for all cropland; from $70 in Oklahoma to $365 in California for irrigated cropland; from $14 in Wyoming to $255 in Iowa for nonirrigated cropland; and from $2 in Arizona to $53 in Illinois for pasture land.
At the county level, the average rental rates for cropland in 2013 ranged from $5.50 per acre for non-irrigated cropland in Sanpete County, Utah, to $2,510 per acre for irrigated cropland in Ventura County, California.
- The five counties with the highest average rent for irrigated cropland were all in California.
- For non-irrigated cropland, the ten counties with the highest average rental rates were in two states: Iowa and Illinois. DeWitt County, Illinois, had the highest rates, at an average of $385 per acre, followed by Sangamon County, Illinois ($371).
- The ten counties with the highest average rental rates for pasture were in Iowa, Indiana, Nebraska, Pennsylvania, and Washington. The highest pasture cash rental rate was $77.50, found in two Iowa counties, Pottawattamie and Harrison.
About the Surveys
The National Agricultural Statistics Service (NASS) conducts the June Area Survey to collect data on crop acreage, land use, grain stocks, farms, rents, and the value of land and sales. In the Cash Rents Survey, NASS collects data on rental rates producers pay for various kinds of agricultural land.
Last Modified: 06/08/2018